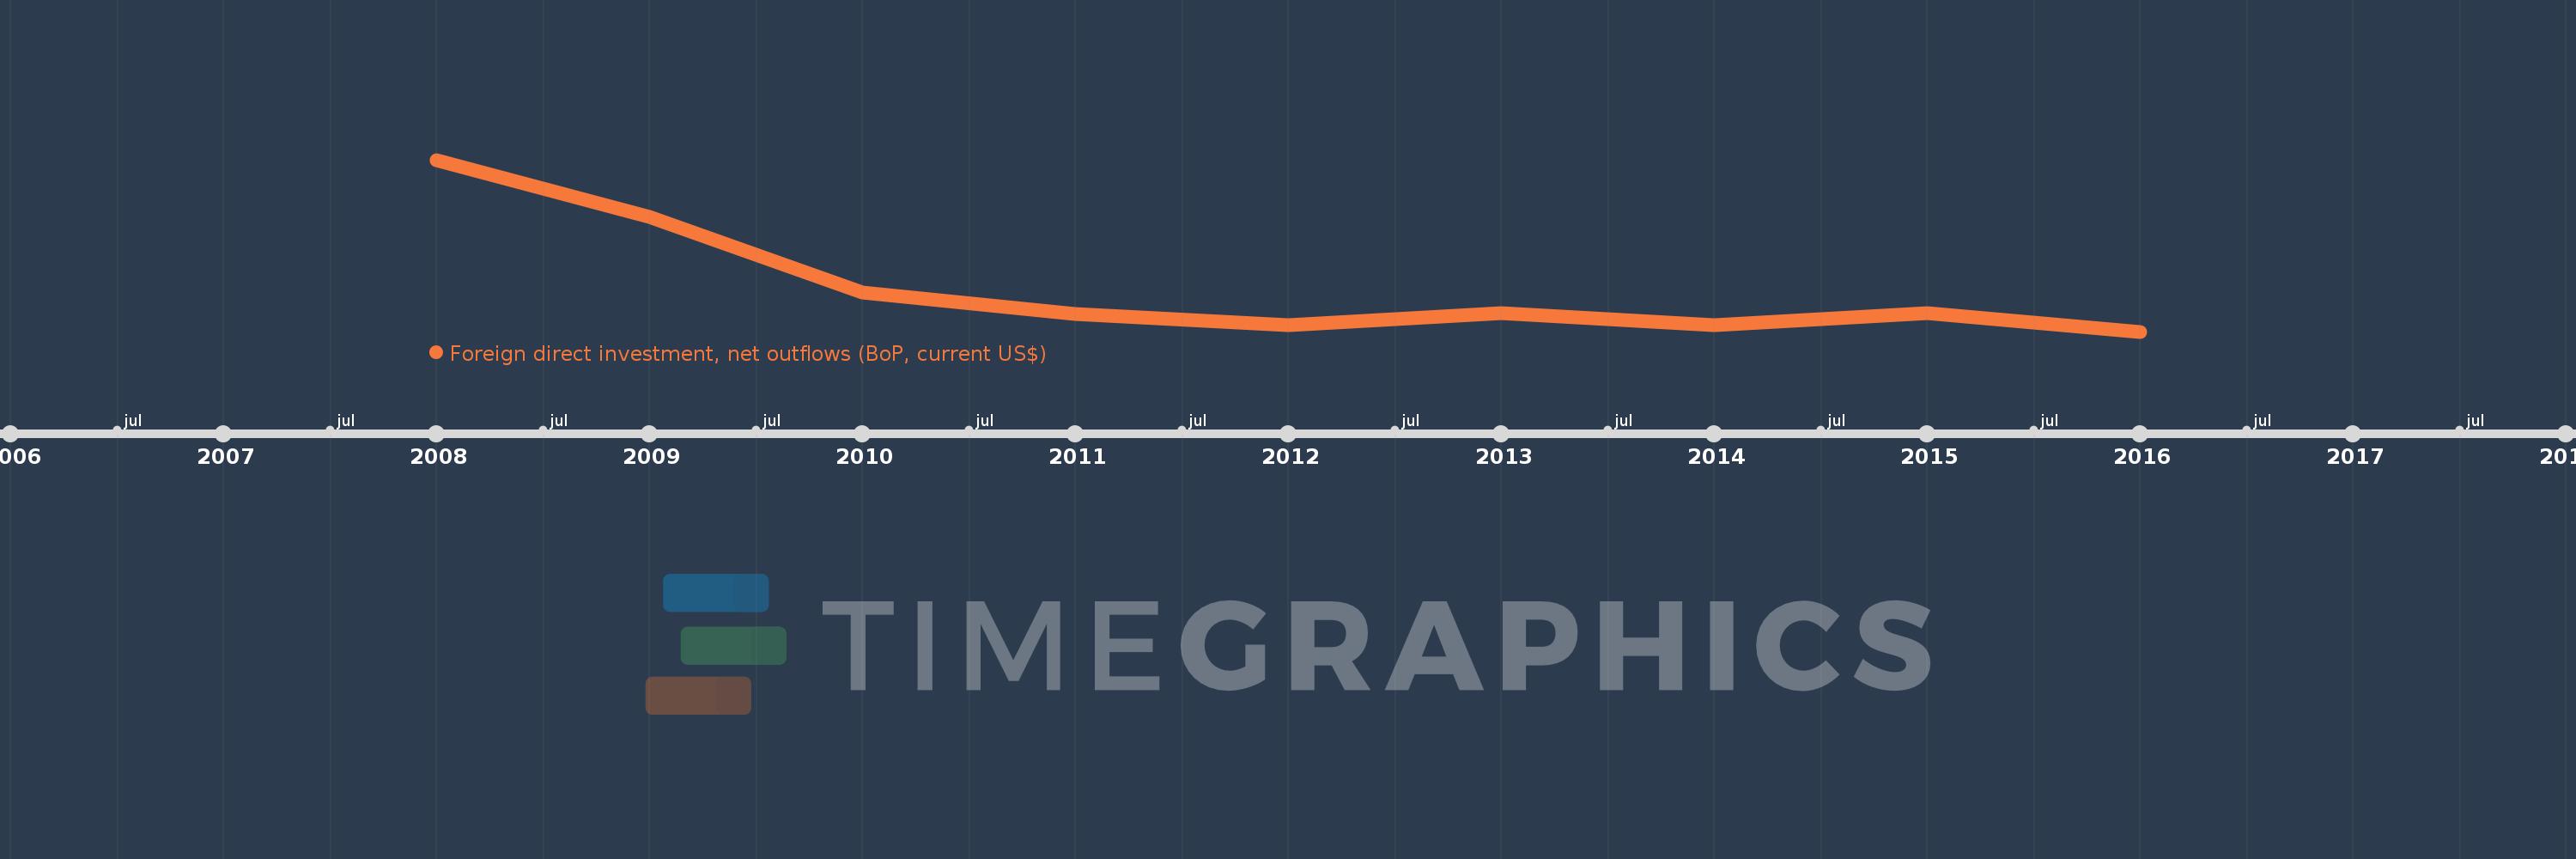
This timeline shows a graph from 2008 to 2016 of Montenegro. No data until 2007. Number of actual observations by date: 9.
Source name:
World Development Indicators
Source organization:
International Monetary Fund, Balance of Payments database, supplemented by data from the United Nations Conference on Trade and Development and official national sources.
Categories, topics:
Economy & Growth, Financial Sector
Last updated:
apr 23, 2017
Indicators value changes by year
Meaning:
49.574 mln
Minimum:
12.393 mln
jan 1, 2016
Maximum:
159.269 mln
jan 1, 2008
At the date of observation
Value
Absolute change
Change from the previous value
jan 1, 2008
159.269 mln
+159.269 mln
0.0%
jan 1, 2009
110.251 mln
-49.018 mln
-30.78%
jan 1, 2010
45.781 mln
-64.47 mln
-58.48%
jan 1, 2011
27.123 mln
-18.658 mln
-40.75%
jan 1, 2012
17.972 mln
-9.151 mln
-33.74%
jan 1, 2013
27.855 mln
+9.883 mln
54.99%
jan 1, 2014
17.649 mln
-10.206 mln
-36.64%
jan 1, 2015
27.877 mln
+10.228 mln
57.95%
jan 1, 2016
12.393 mln
-15.484 mln
-55.54%
Ranking of countries by current statistics by years