29
/
en
AIzaSyAYiBZKx7MnpbEhh9jyipgxe19OcubqV5w
April 1, 2024
99590
Cameroon
CMR
true
2
1
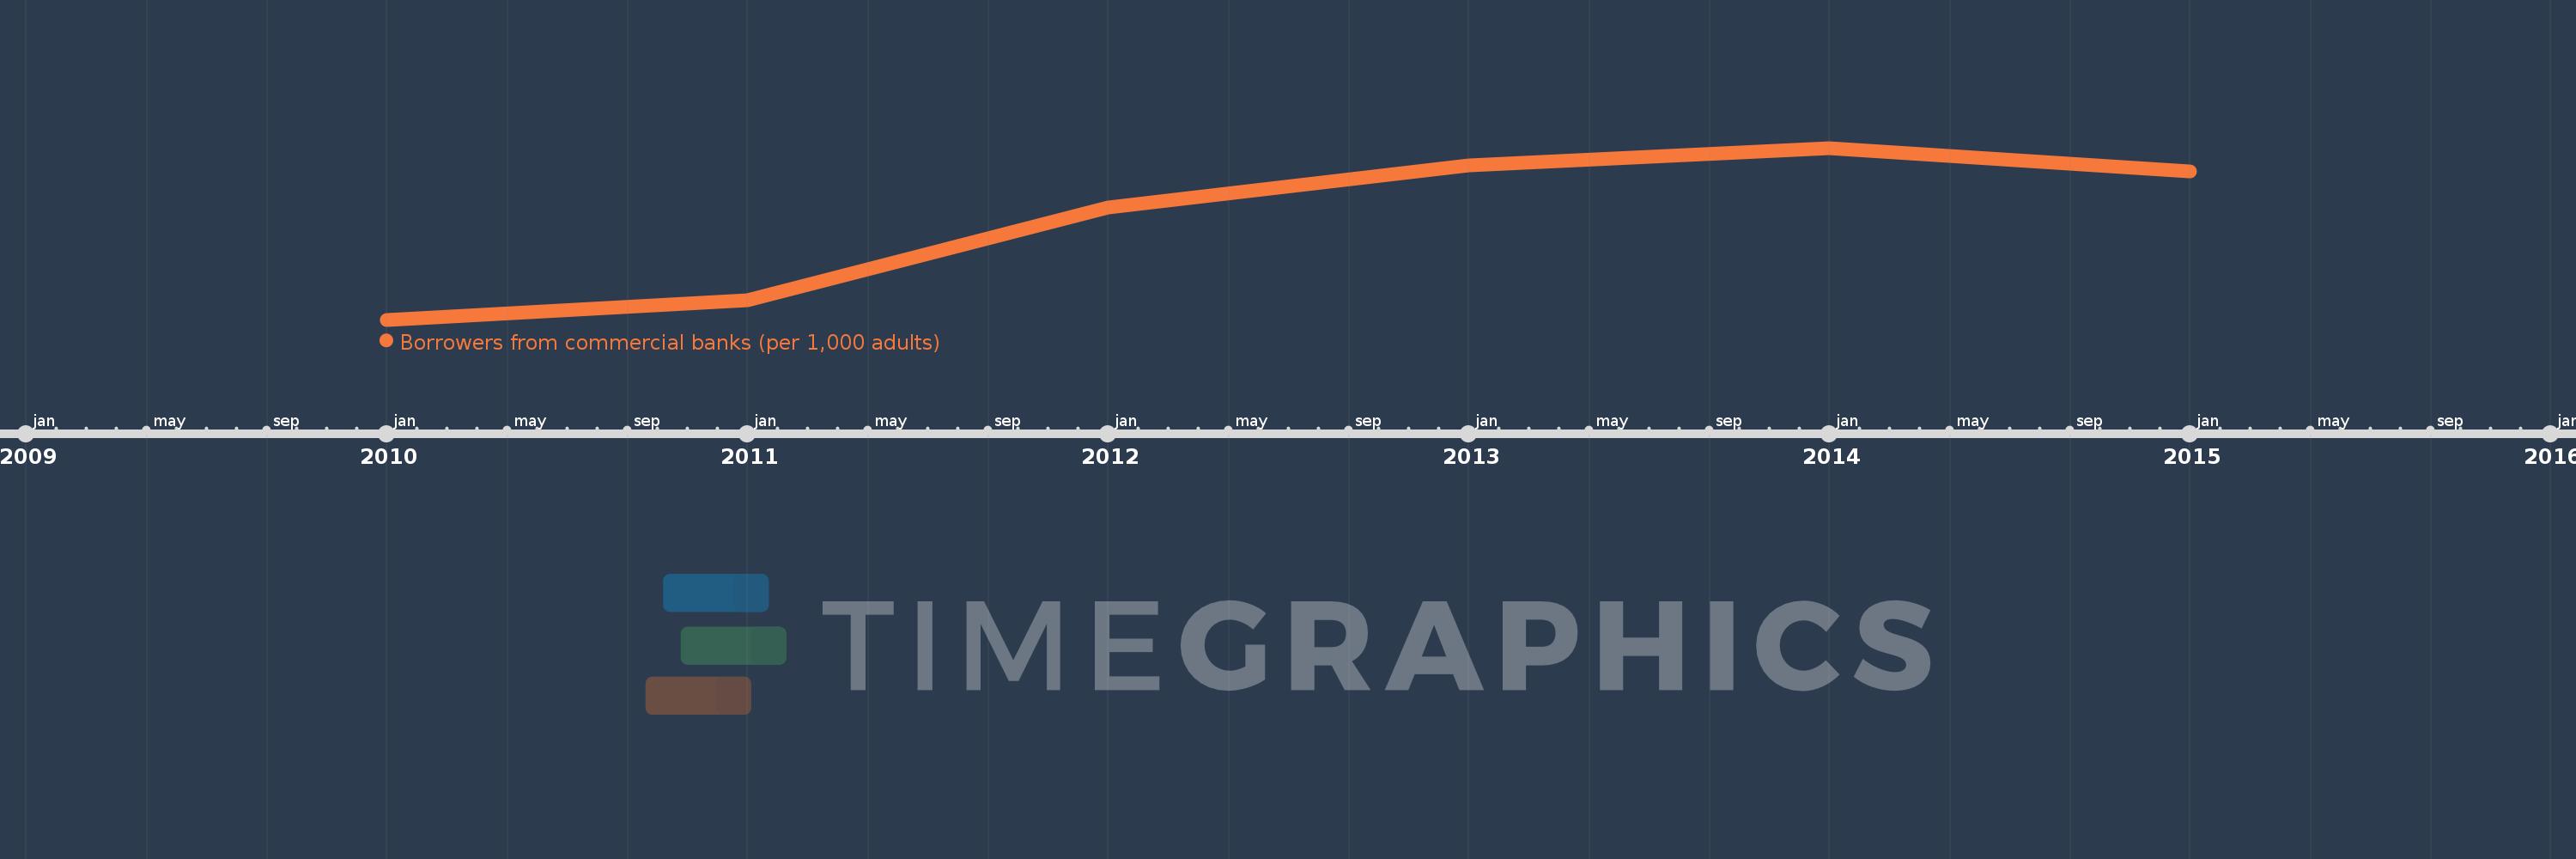
Borrowers from commercial banks (per 1,000 adults)
2015,2014,2013,2012,2011,2010
This statistics in other country:
Timeline:
This timeline shows a graph from 2010 to 2015 of Cameroon. No data until 2009. Number of actual observations by date: 6.
Source name:
World Development Indicators
Source organization:
International Monetary Fund, Financial Access Survey.
Categories, topics:
Financial Sector
Last updated:
apr 23, 2017
Indicators value changes by year
Maximum:
21.901
jan 1, 2014
At the date of observation
Value
Absolute change
Change from previous value
jan 1, 2010
9.73
+9.73
0.0%
jan 1, 2011
11.124
+1.394
14.33%
jan 1, 2012
17.666
+6.542
58.81%
jan 1, 2013
20.689
+3.022
17.11%
jan 1, 2014
21.901
+1.213
5.86%
jan 1, 2015
20.224
-1.678
-7.66%
Ranking of countries by current statistics by years


Comments: