29
/
en
AIzaSyAYiBZKx7MnpbEhh9jyipgxe19OcubqV5w
April 1, 2024
39737
IDA total
IDA
false
2
1
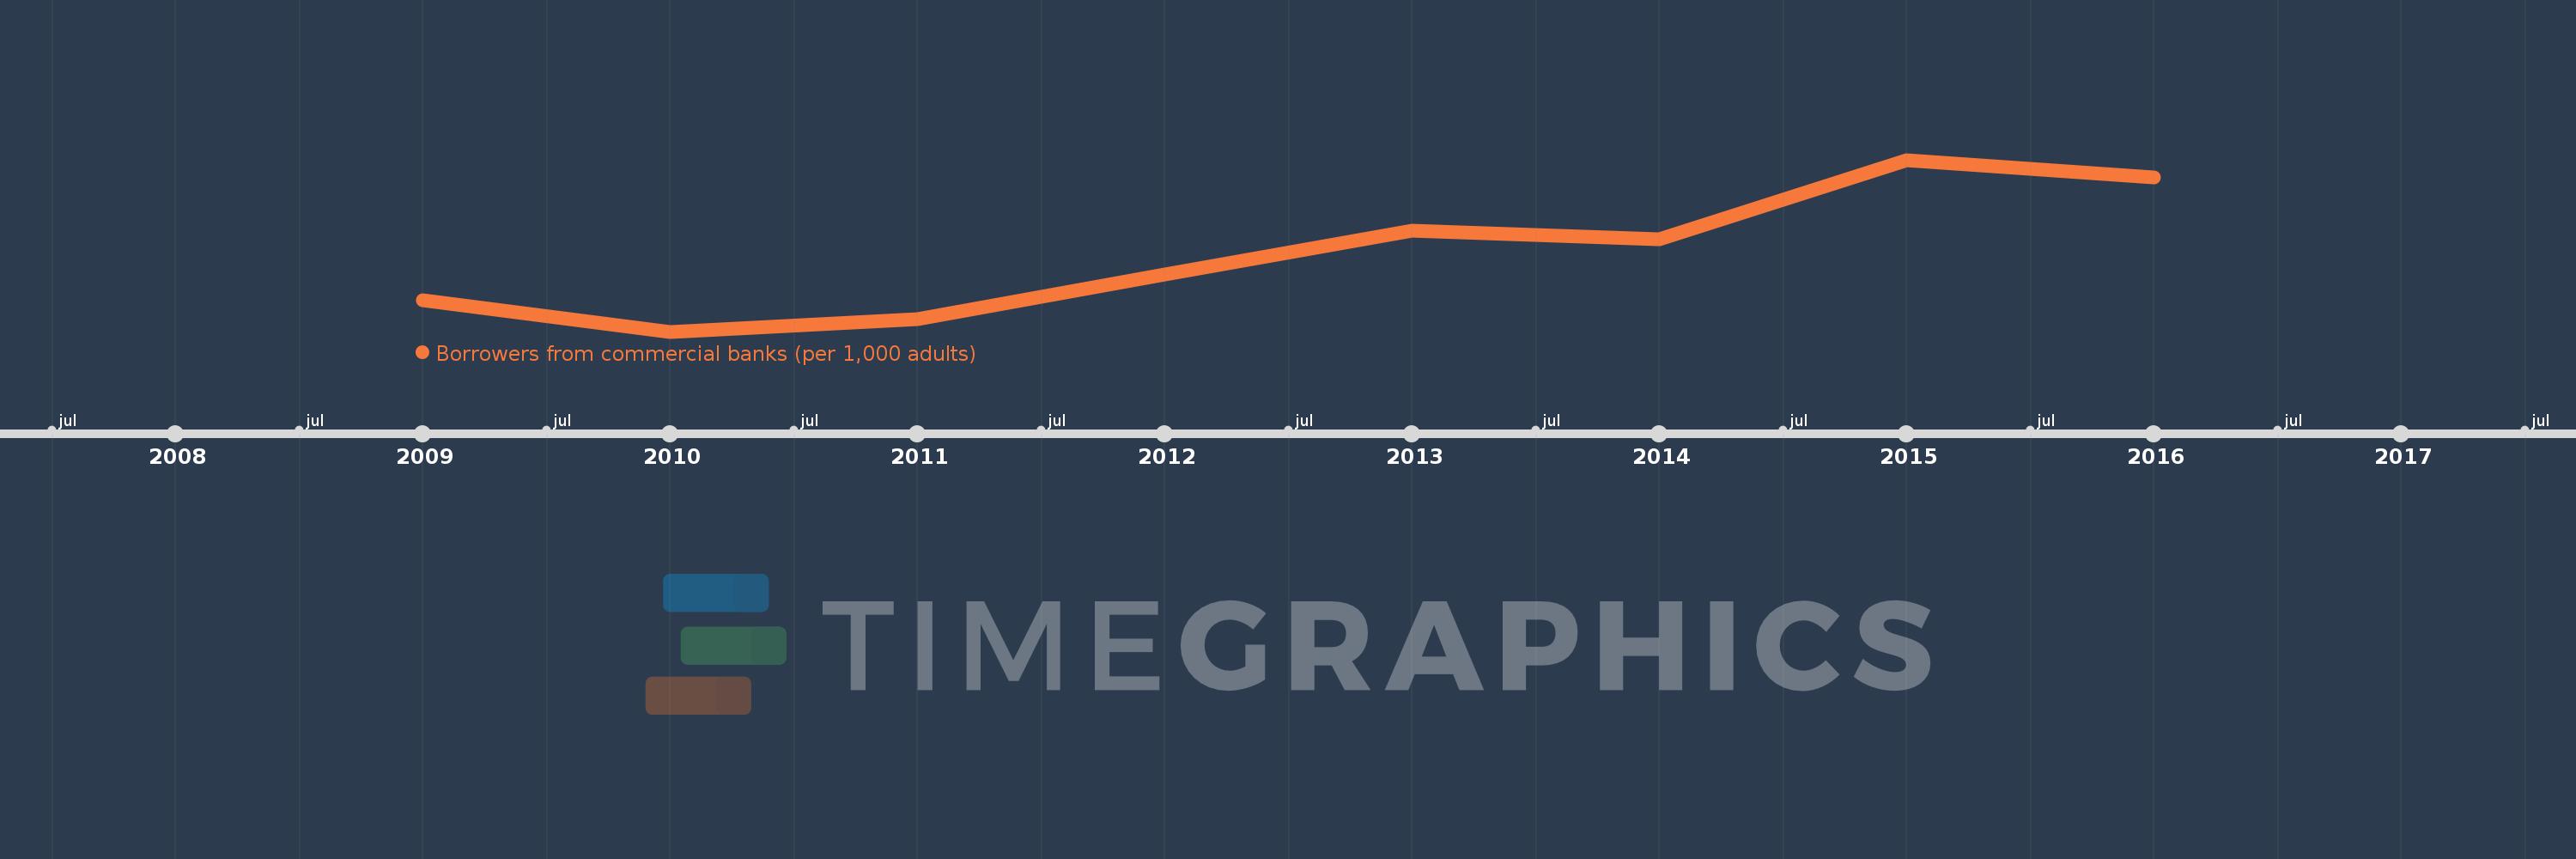
Borrowers from commercial banks (per 1,000 adults)
2016,2015,2014,2013,2012,2011,2010,2009
This statistics in other country:
Timeline:
This timeline shows a graph from 2009 to 2016 of IDA total. No data until 2008. Number of actual observations by date: 8.
Source name:
World Development Indicators
Source organization:
International Monetary Fund, Financial Access Survey.
Categories, topics:
Financial Sector
Last updated:
apr 23, 2017
Indicators value changes by year
Minimum:
16.952
jan 1, 2010
Maximum:
37.467
jan 1, 2015
At the date of observation
Value
Absolute change
Change from previous value
jan 1, 2009
20.688
+20.688
0.0%
jan 1, 2010
16.952
-3.736
-18.06%
jan 1, 2011
18.414
+1.462
8.62%
jan 1, 2012
23.728
+5.314
28.86%
jan 1, 2013
29.043
+5.315
22.4%
jan 1, 2014
28.015
-1.028
-3.54%
jan 1, 2015
37.467
+9.452
33.74%
jan 1, 2016
35.363
-2.103
-5.61%
Ranking of countries by current statistics by years


Comments: