29
/
en
AIzaSyAYiBZKx7MnpbEhh9jyipgxe19OcubqV5w
April 1, 2024
60584
Sub-Saharan Africa (IDA & IBRD countries)
TSS
false
2
1
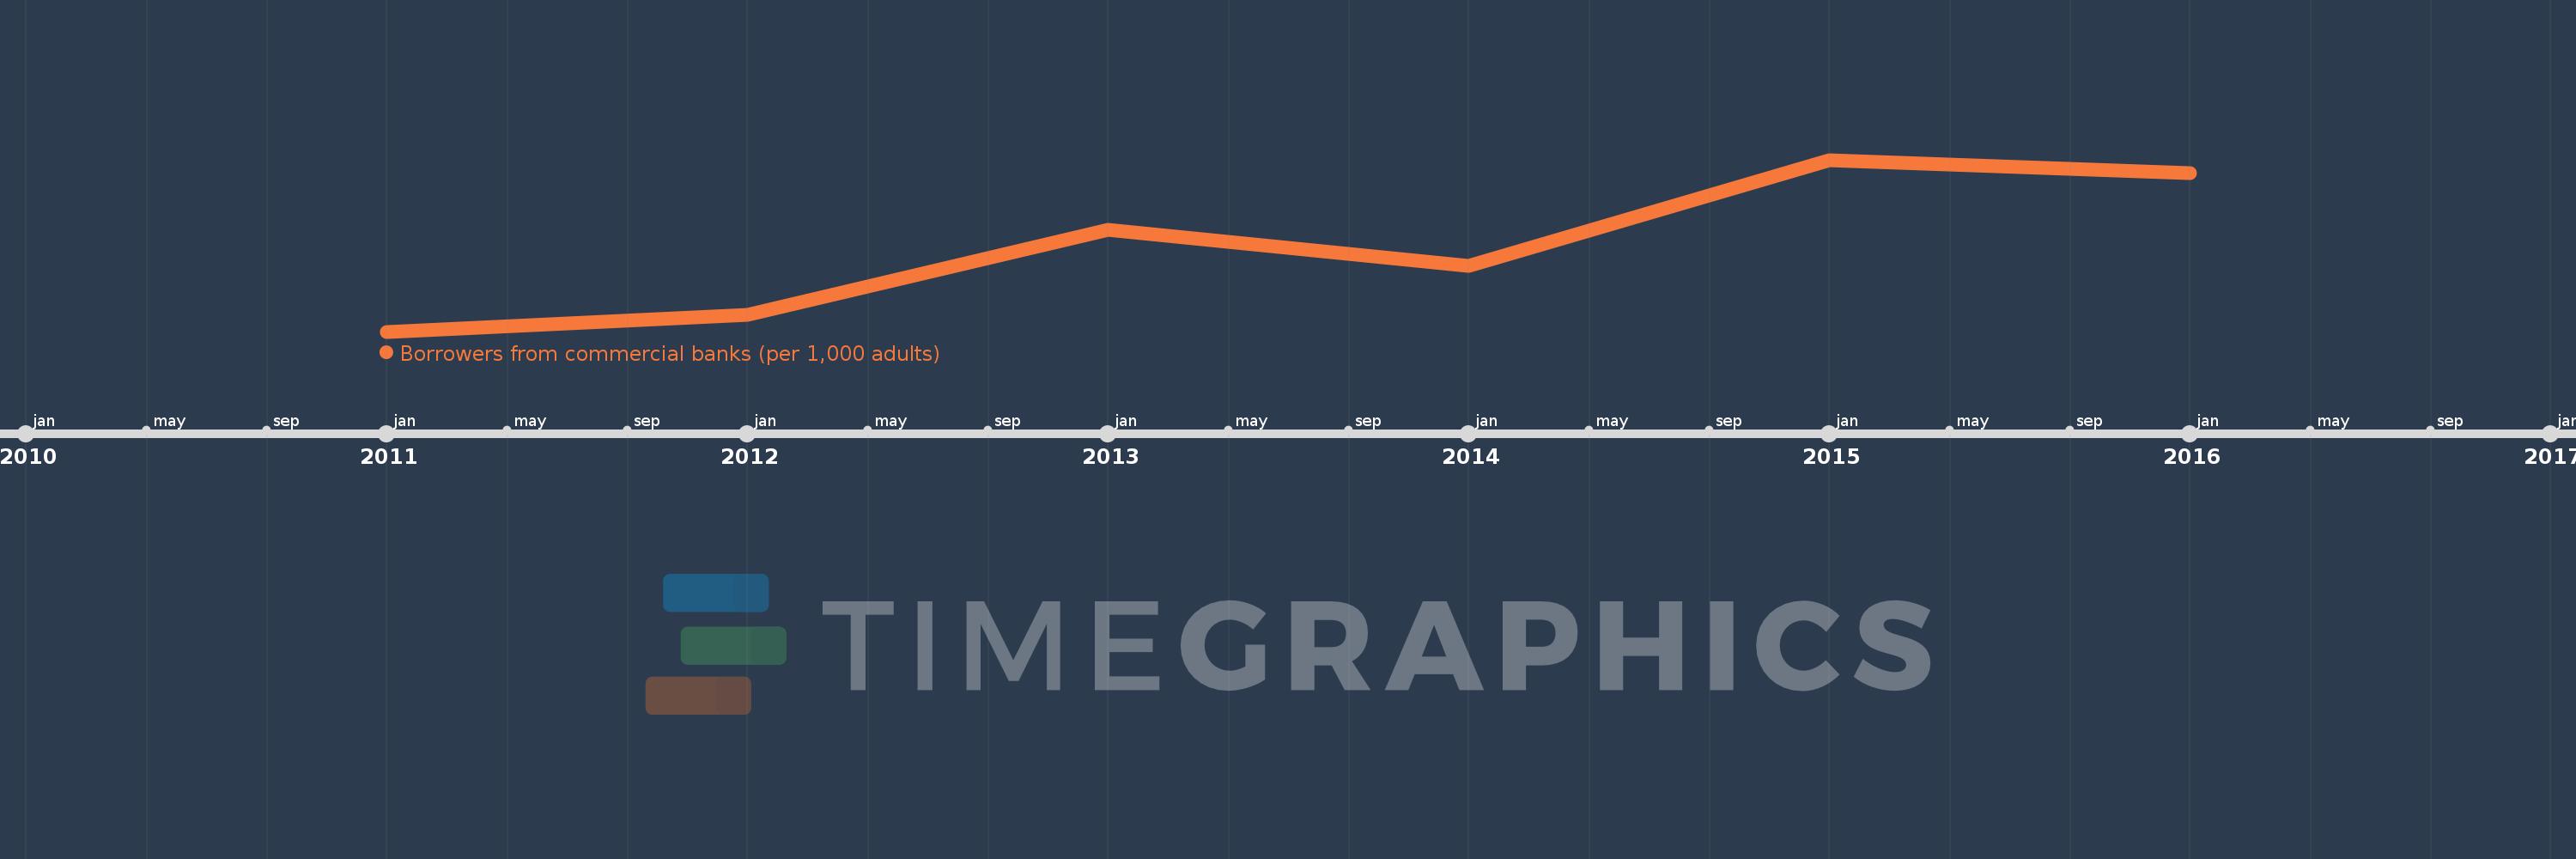
Borrowers from commercial banks (per 1,000 adults)
2016,2015,2014,2013,2012,2011
This statistics in other country:
Timeline:
This timeline shows a graph from 2011 to 2016 of Sub-Saharan Africa (IDA & IBRD countries). No data until 2010. Number of actual observations by date: 6.
Source name:
World Development Indicators
Source organization:
International Monetary Fund, Financial Access Survey.
Categories, topics:
Financial Sector
Last updated:
apr 23, 2017
Indicators value changes by year
Minimum:
18.249
jan 1, 2011
Maximum:
36.433
jan 1, 2015
At the date of observation
Value
Absolute change
Change from previous value
jan 1, 2011
18.249
+18.249
0.0%
jan 1, 2012
19.991
+1.742
9.54%
jan 1, 2013
29.043
+9.052
45.28%
jan 1, 2014
25.173
-3.87
-13.32%
jan 1, 2015
36.433
+11.26
44.73%
jan 1, 2016
35.061
-1.372
-3.77%
Ranking of countries by current statistics by years


Comments: