29
/
en
AIzaSyAYiBZKx7MnpbEhh9jyipgxe19OcubqV5w
April 1, 2024
233406
Sao Tome and Principe
STP
true
2
1
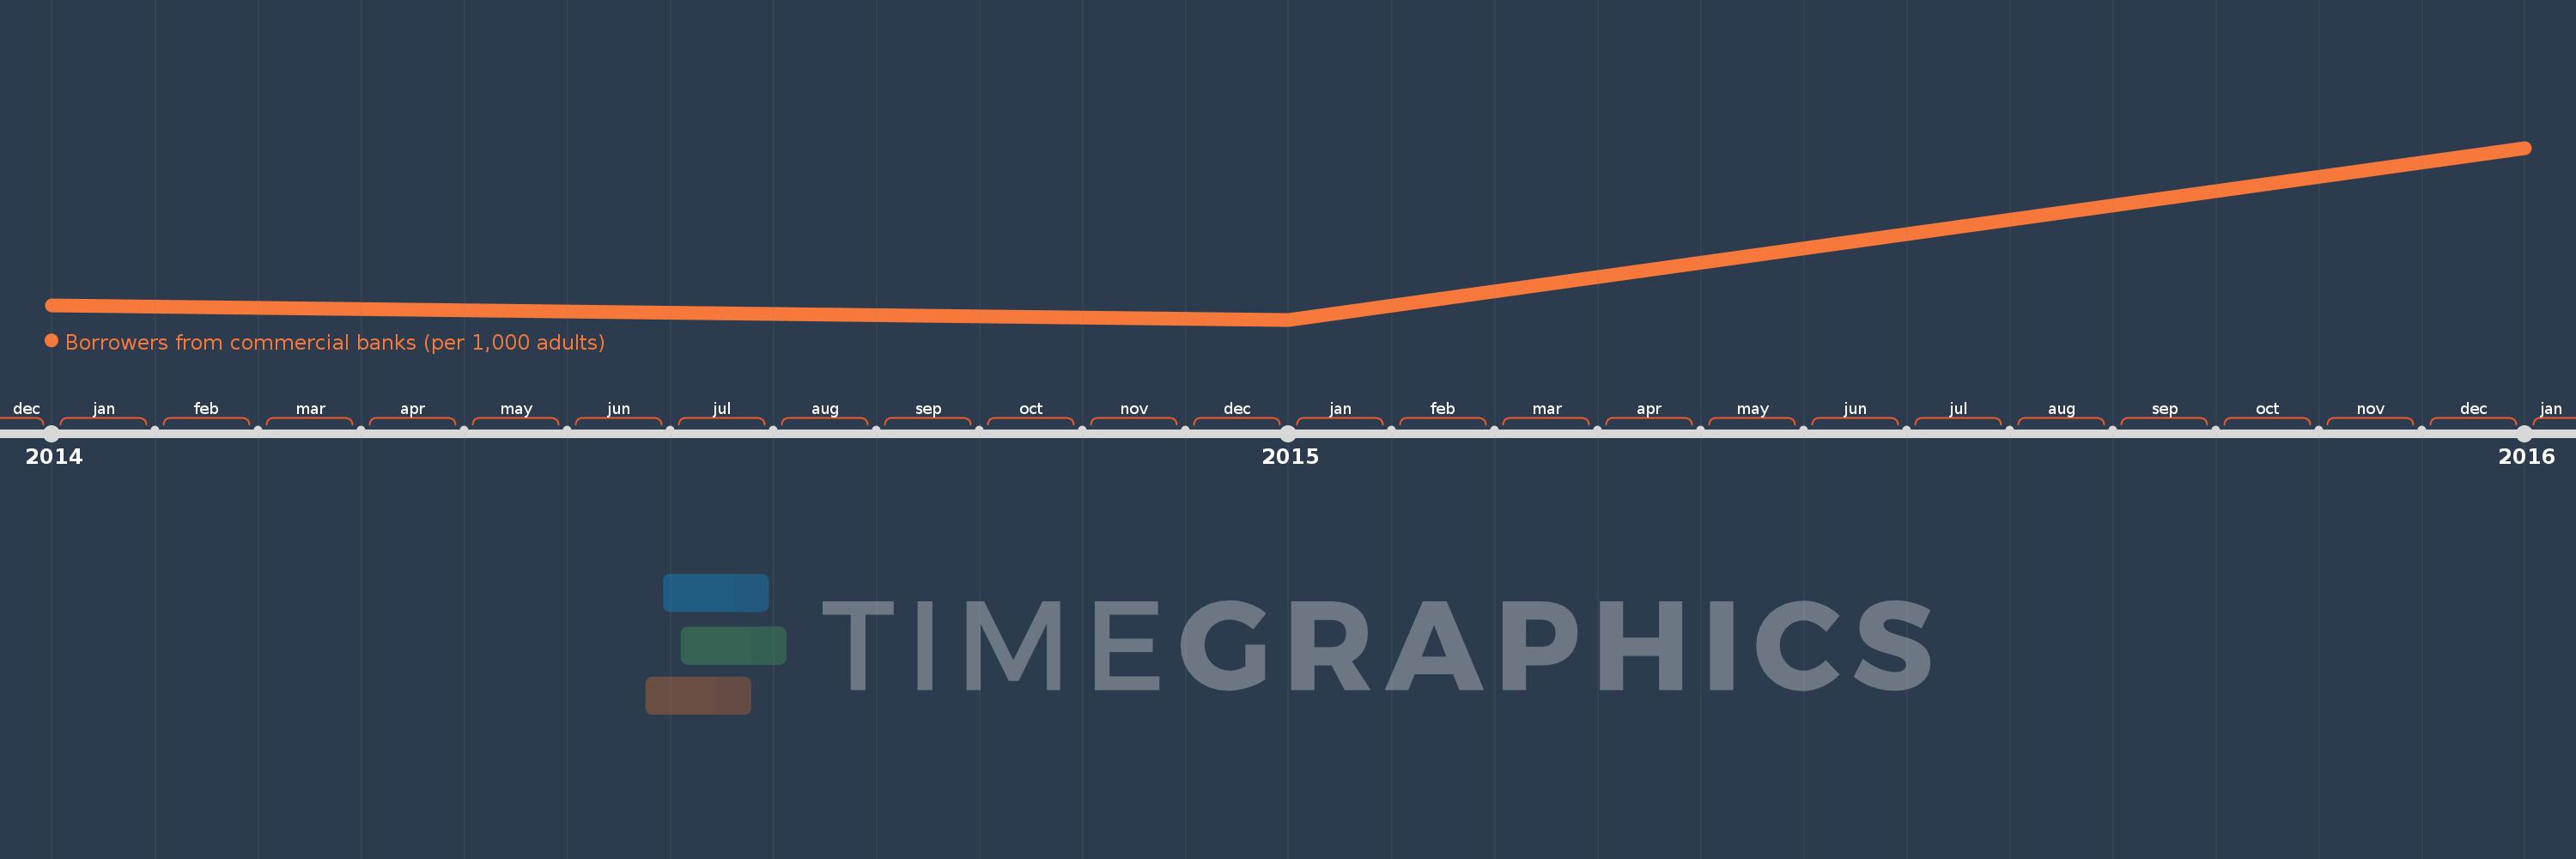
Borrowers from commercial banks (per 1,000 adults)
2016,2015,2014
This statistics in other country:
Timeline:
This timeline shows a graph from 2014 to 2016 of Sao Tome and Principe. No data until 2013. Number of actual observations by date: 3.
Source name:
World Development Indicators
Source organization:
International Monetary Fund, Financial Access Survey.
Categories, topics:
Financial Sector
Last updated:
apr 23, 2017
Indicators value changes by year
Minimum:
63.359
jan 1, 2015
Maximum:
120.544
jan 1, 2016
At the date of observation
Value
Absolute change
Change from previous value
jan 1, 2014
68.027
+68.027
0.0%
jan 1, 2015
63.359
-4.668
-6.86%
jan 1, 2016
120.544
+57.185
90.26%
Ranking of countries by current statistics by years


Comments: