29
/
en
AIzaSyAYiBZKx7MnpbEhh9jyipgxe19OcubqV5w
April 1, 2024
65723
Algeria
DZA
true
2
1
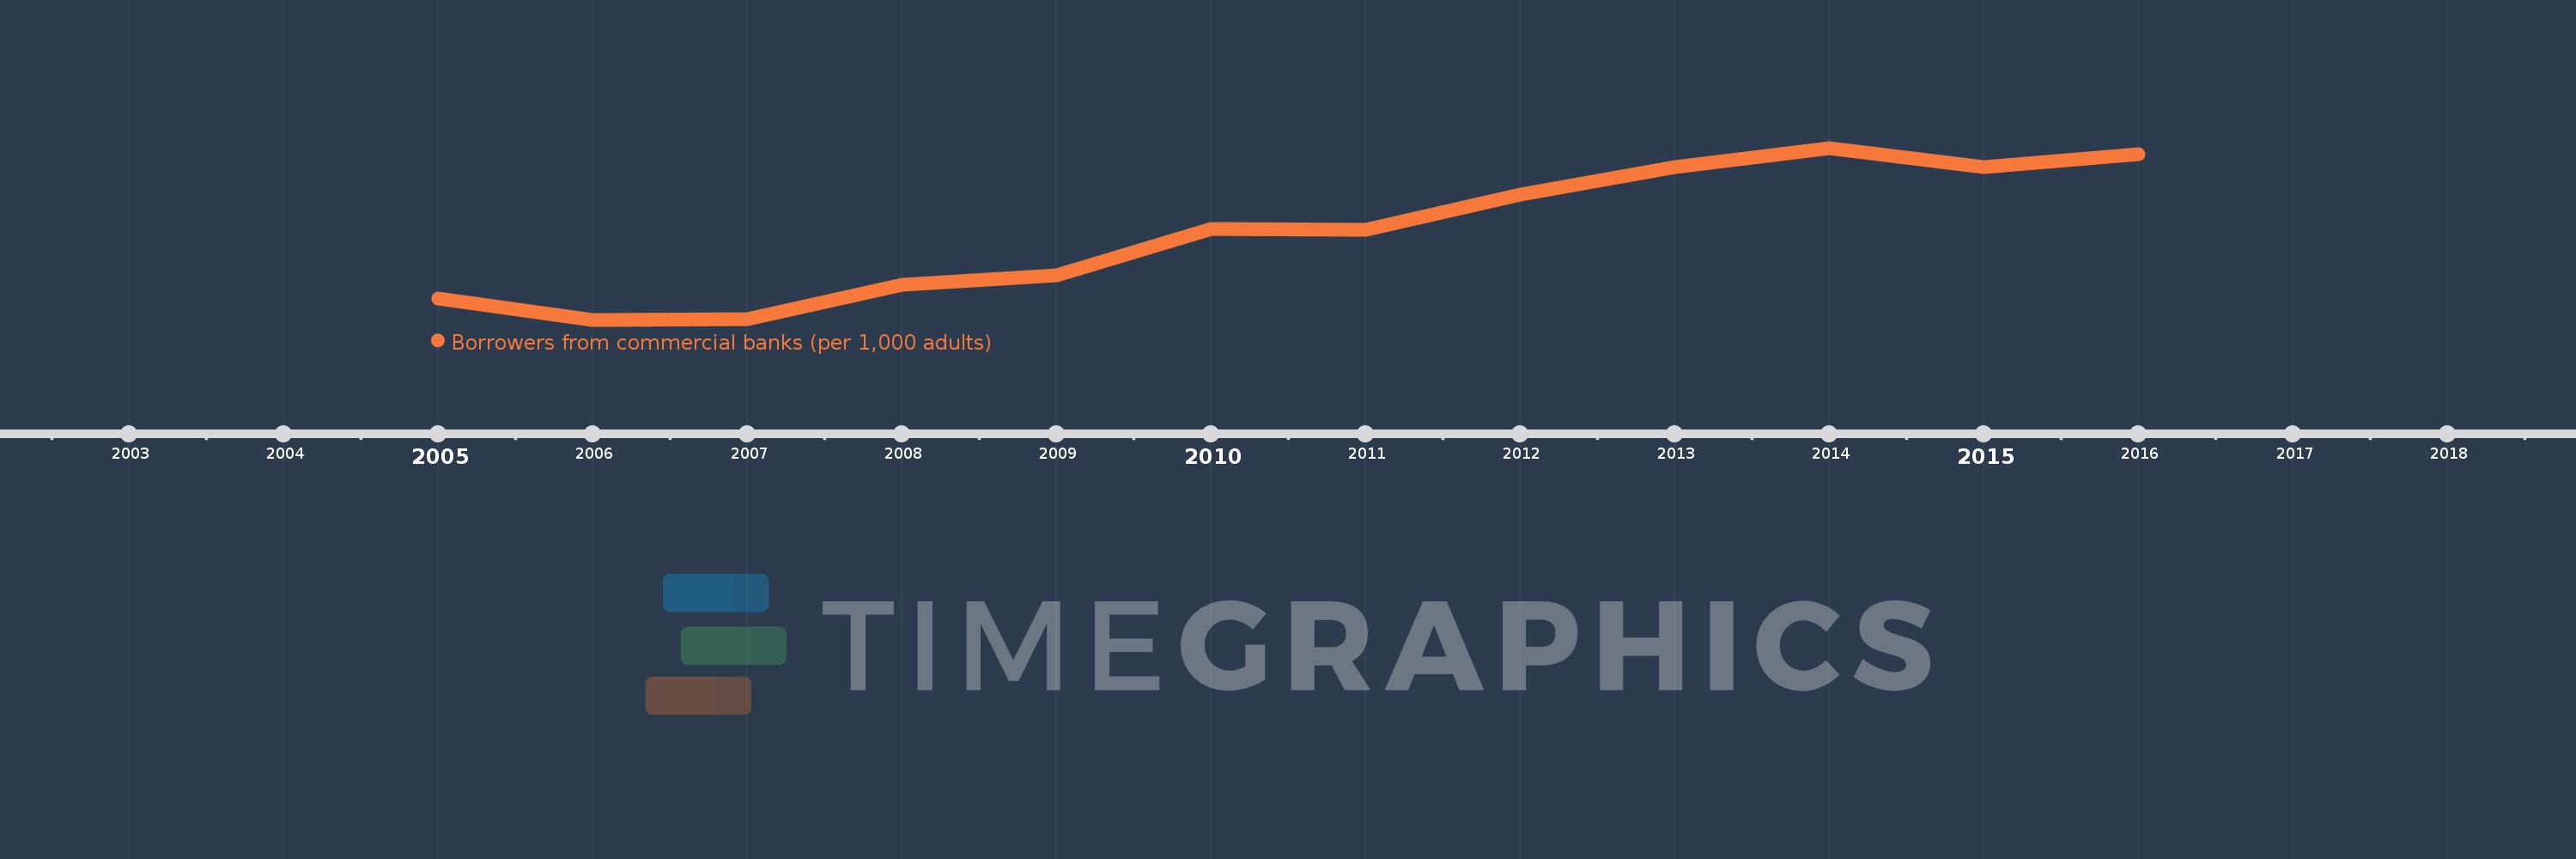
Borrowers from commercial banks (per 1,000 adults)
2016,2015,2014,2013,2012,2011,2010,2009,2008,2007,2006,2005
This statistics in other country:
Timeline:
This timeline shows a graph from 2005 to 2016 of Algeria. No data until 2004. Number of actual observations by date: 12.
Source name:
World Development Indicators
Source organization:
International Monetary Fund, Financial Access Survey.
Categories, topics:
Financial Sector
Last updated:
apr 23, 2017
Indicators value changes by year
Minimum:
23.019
jan 1, 2006
Maximum:
44.954
jan 1, 2014
At the date of observation
Value
Absolute change
Change from previous value
jan 1, 2005
25.773
+25.773
0.0%
jan 1, 2006
23.019
-2.753
-10.68%
jan 1, 2007
23.081
+0.062
0.27%
jan 1, 2008
27.493
+4.412
19.11%
jan 1, 2009
28.655
+1.162
4.23%
jan 1, 2010
34.633
+5.978
20.86%
jan 1, 2011
34.5
-0.133
-0.38%
jan 1, 2012
38.974
+4.474
12.97%
jan 1, 2013
42.485
+3.511
9.01%
jan 1, 2014
44.954
+2.468
5.81%
jan 1, 2015
42.495
-2.459
-5.47%
jan 1, 2016
44.206
+1.711
4.03%
Ranking of countries by current statistics by years


Comments: