29
/
en
AIzaSyAYiBZKx7MnpbEhh9jyipgxe19OcubqV5w
April 1, 2024
197200
Moldova
MDA
true
2
1
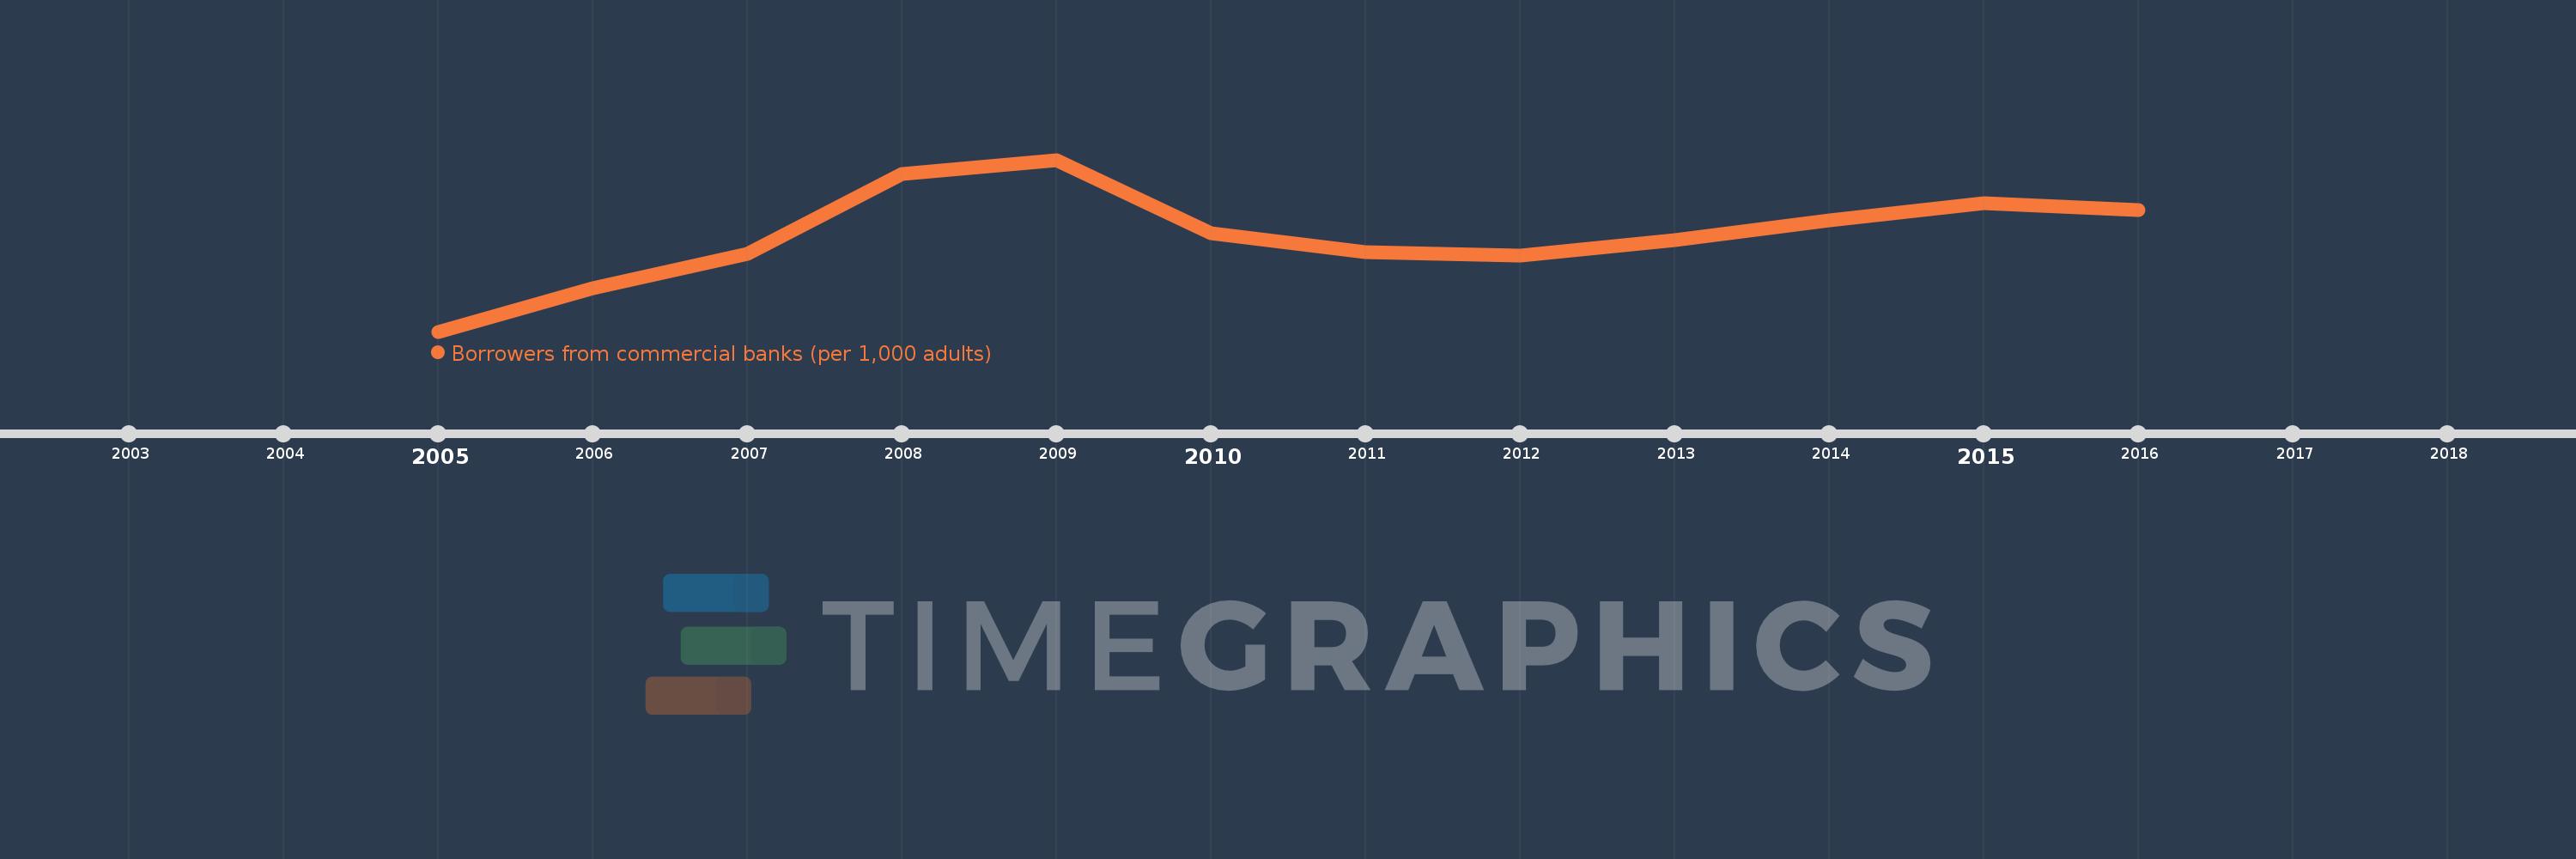
Borrowers from commercial banks (per 1,000 adults)
2016,2015,2014,2013,2012,2011,2010,2009,2008,2007,2006,2005
This statistics in other country:
Timeline:
This timeline shows a graph from 2005 to 2016 of Moldova. No data until 2004. Number of actual observations by date: 12.
Source name:
World Development Indicators
Source organization:
International Monetary Fund, Financial Access Survey.
Categories, topics:
Financial Sector
Last updated:
apr 23, 2017
Indicators value changes by year
Maximum:
63.859
jan 1, 2009
At the date of observation
Value
Absolute change
Change from previous value
jan 1, 2005
15.51
+15.51
0.0%
jan 1, 2006
27.781
+12.271
79.11%
jan 1, 2007
37.41
+9.629
34.66%
jan 1, 2008
59.966
+22.556
60.29%
jan 1, 2009
63.859
+3.893
6.49%
jan 1, 2010
43.303
-20.556
-32.19%
jan 1, 2011
37.964
-5.338
-12.33%
jan 1, 2012
36.982
-0.983
-2.59%
jan 1, 2013
41.227
+4.245
11.48%
jan 1, 2014
46.717
+5.49
13.32%
jan 1, 2015
51.544
+4.827
10.33%
jan 1, 2016
49.635
-1.909
-3.7%
Ranking of countries by current statistics by years


Comments: