29
/
en
AIzaSyAYiBZKx7MnpbEhh9jyipgxe19OcubqV5w
April 1, 2024
150027
Honduras
HND
true
2
1
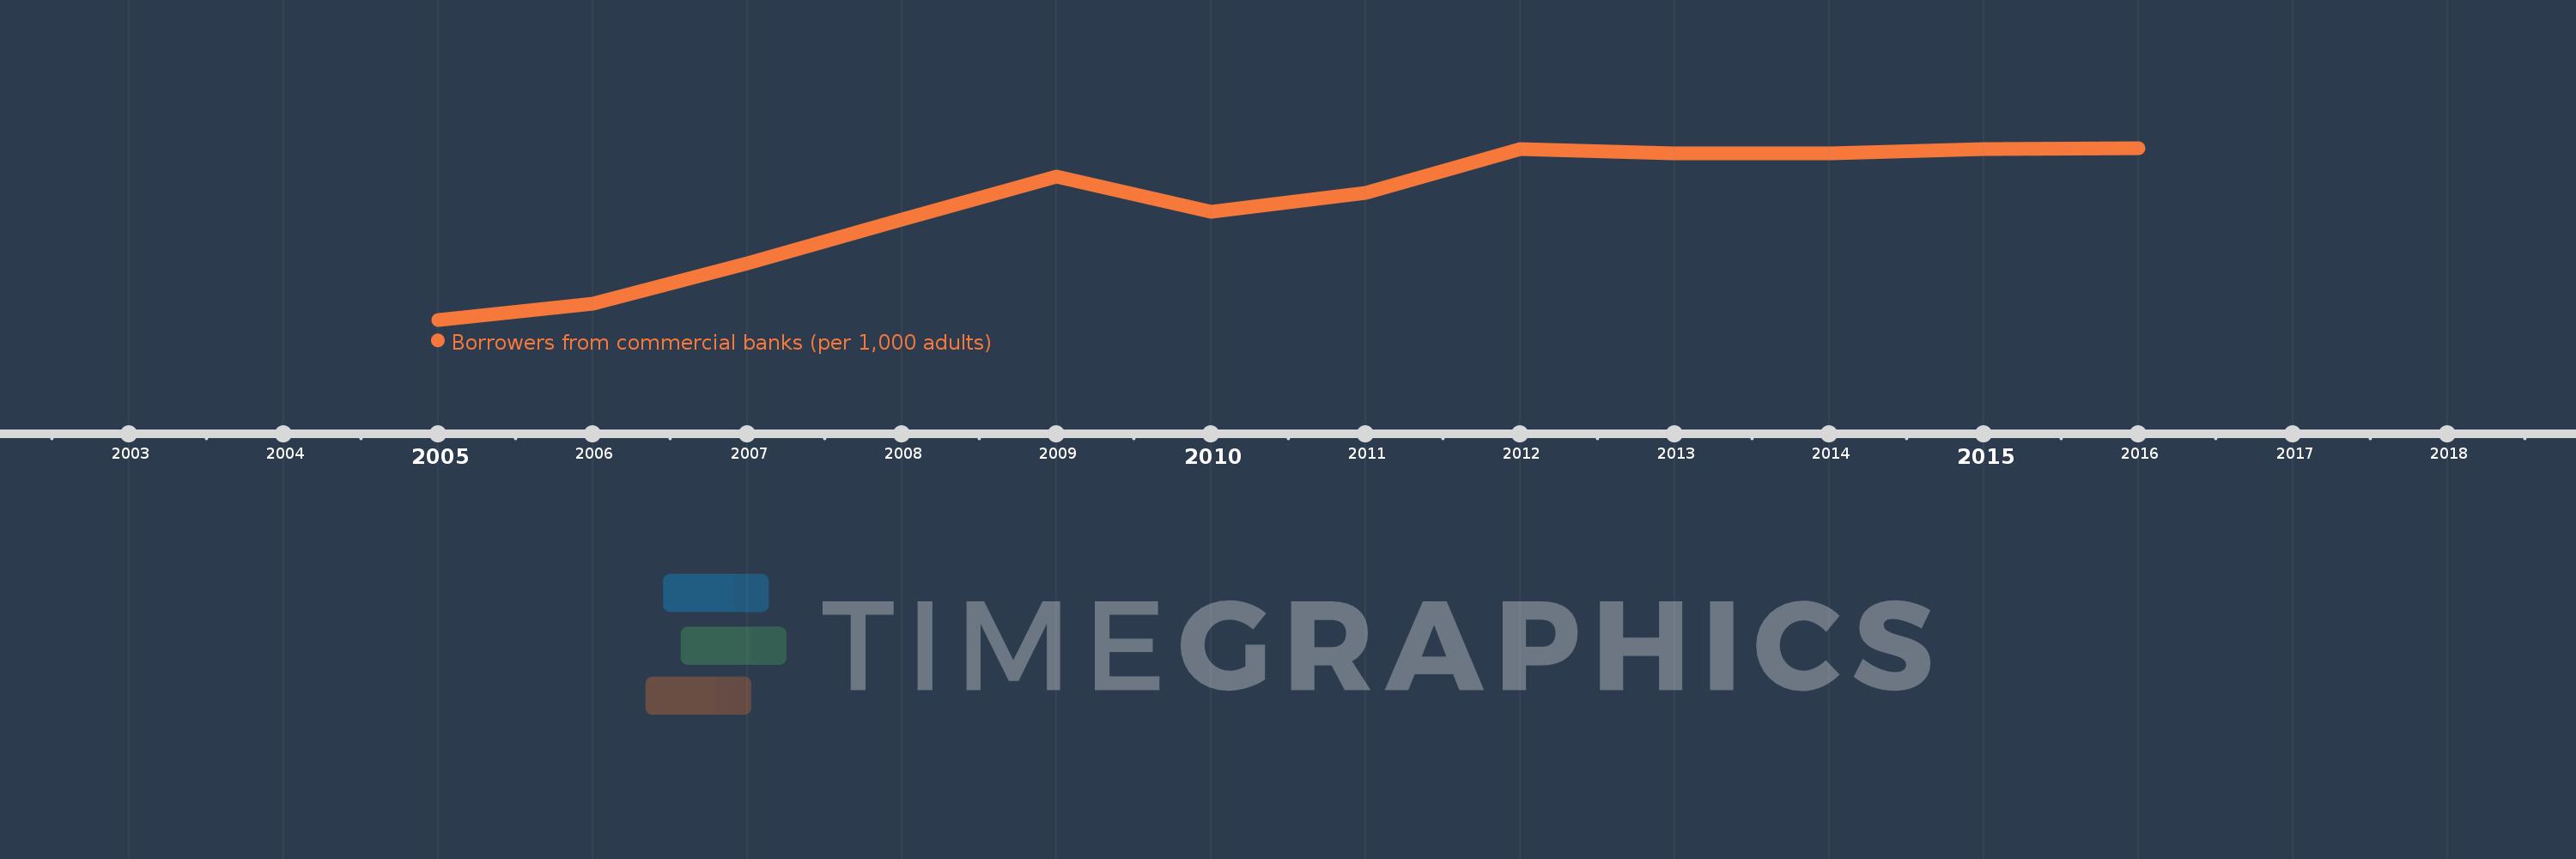
Borrowers from commercial banks (per 1,000 adults)
2016,2015,2014,2013,2012,2011,2010,2009,2008,2007,2006,2005
This statistics in other country:
Timeline:
This timeline shows a graph from 2005 to 2016 of Honduras. No data until 2004. Number of actual observations by date: 12.
Source name:
World Development Indicators
Source organization:
International Monetary Fund, Financial Access Survey.
Categories, topics:
Financial Sector
Last updated:
apr 23, 2017
Indicators value changes by year
Minimum:
54.522
jan 1, 2005
Maximum:
121.617
jan 1, 2016
At the date of observation
Value
Absolute change
Change from previous value
jan 1, 2005
54.522
+54.522
0.0%
jan 1, 2006
60.904
+6.383
11.71%
jan 1, 2007
76.537
+15.633
25.67%
jan 1, 2008
93.663
+17.126
22.38%
jan 1, 2009
110.297
+16.633
17.76%
jan 1, 2010
96.647
-13.649
-12.38%
jan 1, 2011
104.17
+7.522
7.78%
jan 1, 2012
121.256
+17.087
16.4%
jan 1, 2013
119.48
-1.776
-1.47%
jan 1, 2014
119.534
+0.054
0.04%
jan 1, 2015
121.149
+1.615
1.35%
jan 1, 2016
121.617
+0.468
0.39%
Ranking of countries by current statistics by years


Comments: