29
/
en
AIzaSyAYiBZKx7MnpbEhh9jyipgxe19OcubqV5w
April 1, 2024
56061
Small states
SST
false
2
1
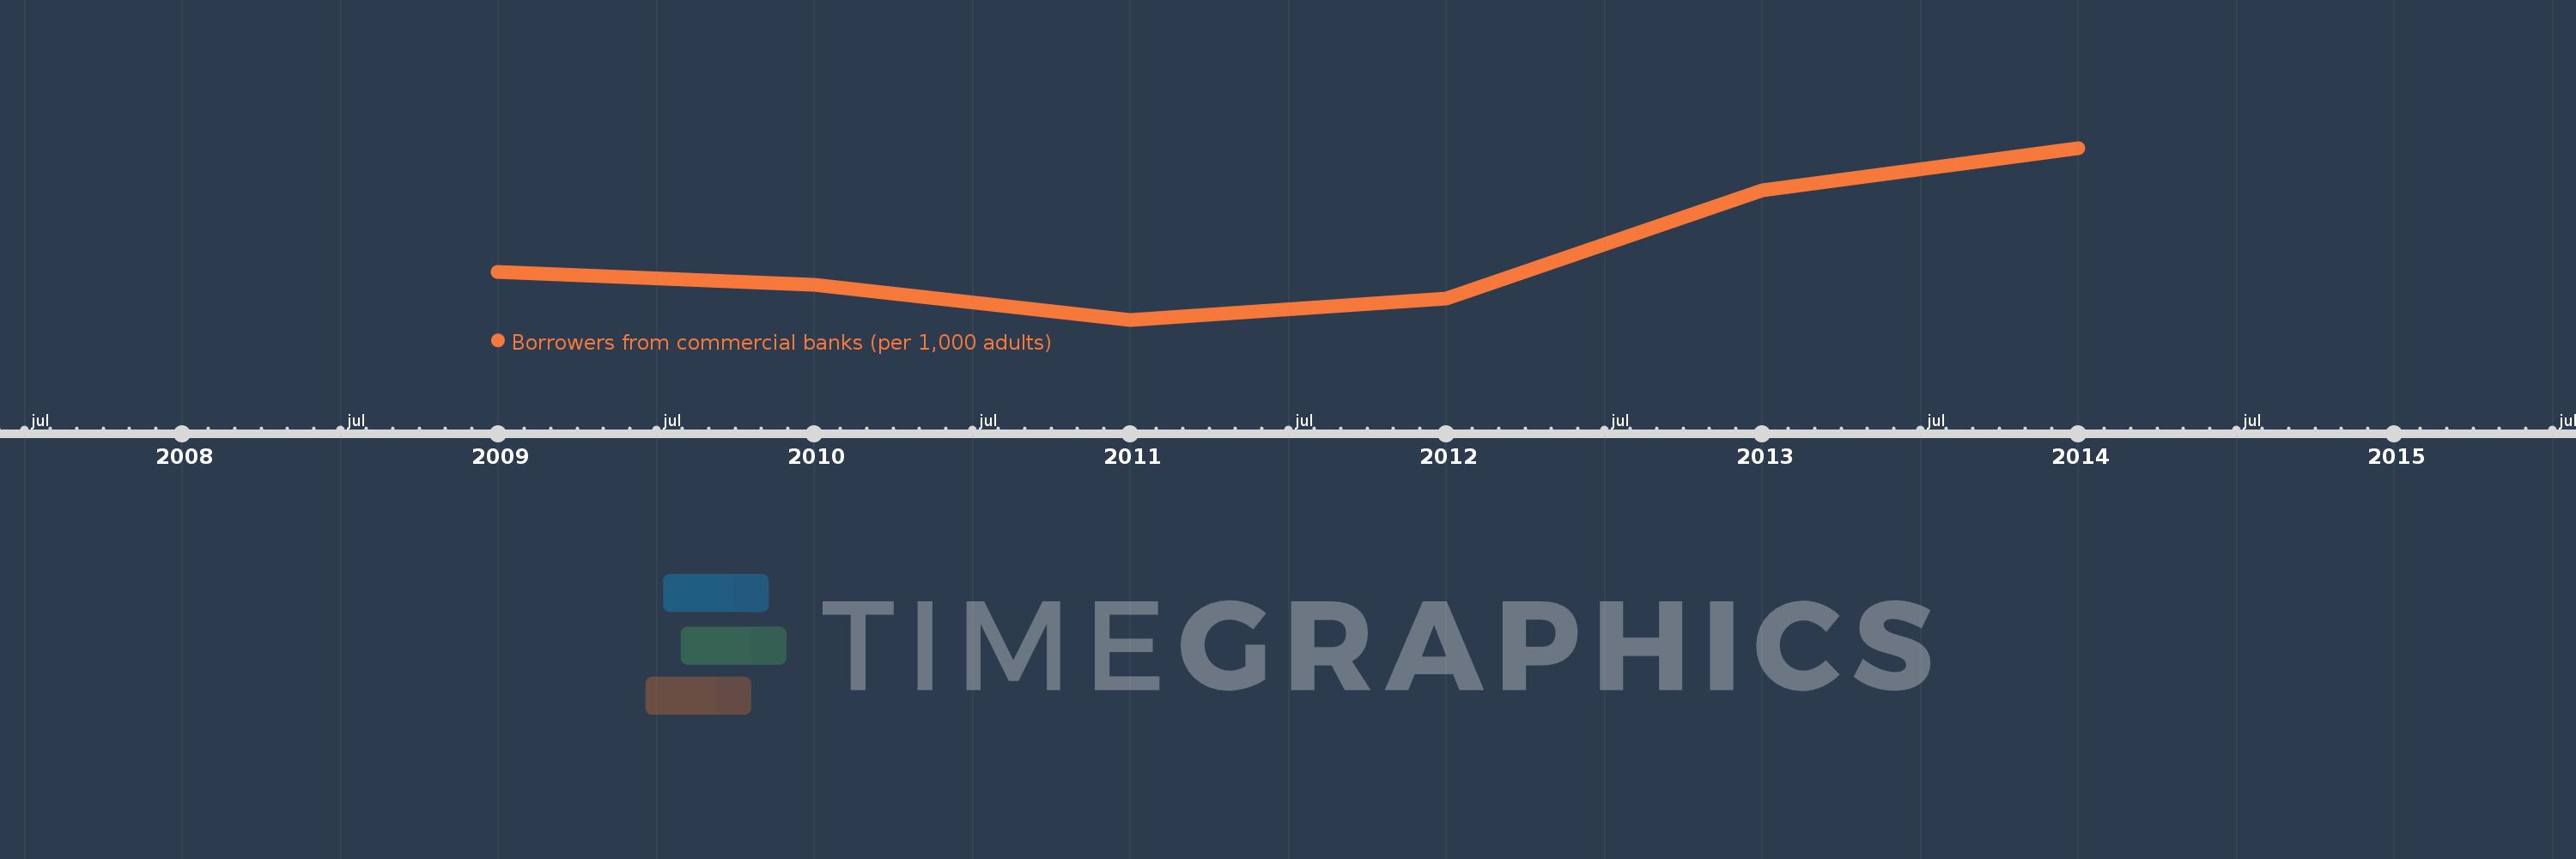
Borrowers from commercial banks (per 1,000 adults)
2014,2013,2012,2011,2010,2009
This statistics in other country:
Timeline:
This timeline shows a graph from 2009 to 2014 of Small states. No data until 2008. Number of actual observations by date: 6.
Source name:
World Development Indicators
Source organization:
International Monetary Fund, Financial Access Survey.
Categories, topics:
Financial Sector
Last updated:
apr 23, 2017
Indicators value changes by year
Minimum:
113.073
jan 1, 2011
Maximum:
155.039
jan 1, 2014
At the date of observation
Value
Absolute change
Change from previous value
jan 1, 2009
124.777
+124.777
0.0%
jan 1, 2010
121.557
-3.22
-2.58%
jan 1, 2011
113.073
-8.485
-6.98%
jan 1, 2012
118.297
+5.224
4.62%
jan 1, 2013
144.658
+26.361
22.28%
jan 1, 2014
155.039
+10.381
7.18%
Ranking of countries by current statistics by years


Comments: