29
/
en
AIzaSyAYiBZKx7MnpbEhh9jyipgxe19OcubqV5w
April 1, 2024
86879
Bolivia
BOL
true
2
1
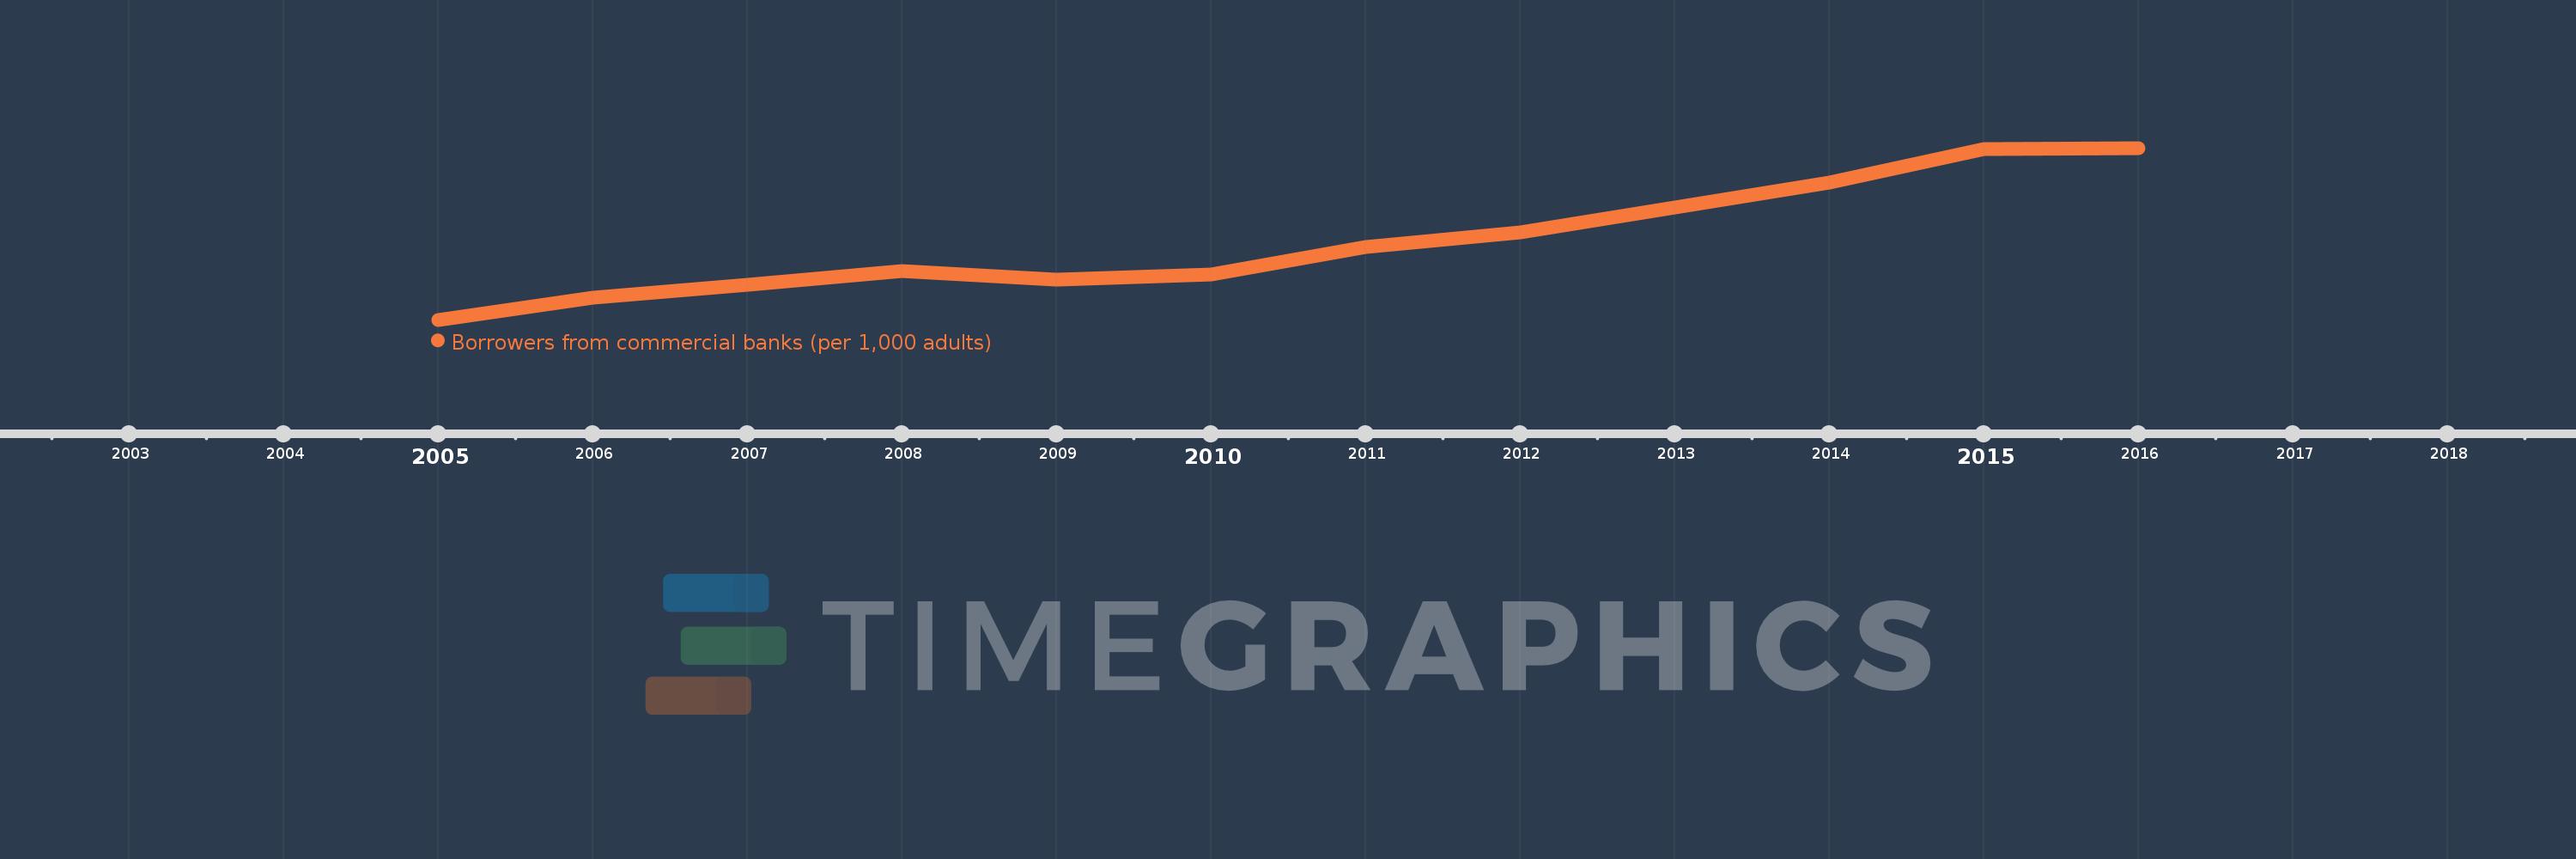
Borrowers from commercial banks (per 1,000 adults)
2016,2015,2014,2013,2012,2011,2010,2009,2008,2007,2006,2005
This statistics in other country:
Timeline:
This timeline shows a graph from 2005 to 2016 of Bolivia. No data until 2004. Number of actual observations by date: 12.
Source name:
World Development Indicators
Source organization:
International Monetary Fund, Financial Access Survey.
Categories, topics:
Financial Sector
Last updated:
apr 23, 2017
Indicators value changes by year
Minimum:
36.405
jan 1, 2005
Maximum:
151.953
jan 1, 2016
At the date of observation
Value
Absolute change
Change from previous value
jan 1, 2005
36.405
+36.405
0.0%
jan 1, 2006
51.184
+14.779
40.6%
jan 1, 2007
59.645
+8.462
16.53%
jan 1, 2008
68.946
+9.3
15.59%
jan 1, 2009
63.443
-5.502
-7.98%
jan 1, 2010
66.829
+3.385
5.34%
jan 1, 2011
85.52
+18.691
27.97%
jan 1, 2012
95.041
+9.521
11.13%
jan 1, 2013
111.849
+16.808
17.68%
jan 1, 2014
128.741
+16.892
15.1%
jan 1, 2015
150.962
+22.22
17.26%
jan 1, 2016
151.953
+0.991
0.66%
Ranking of countries by current statistics by years


Comments: