29
/
en
AIzaSyAYiBZKx7MnpbEhh9jyipgxe19OcubqV5w
April 1, 2024
188752
Maldives
MDV
true
2
1
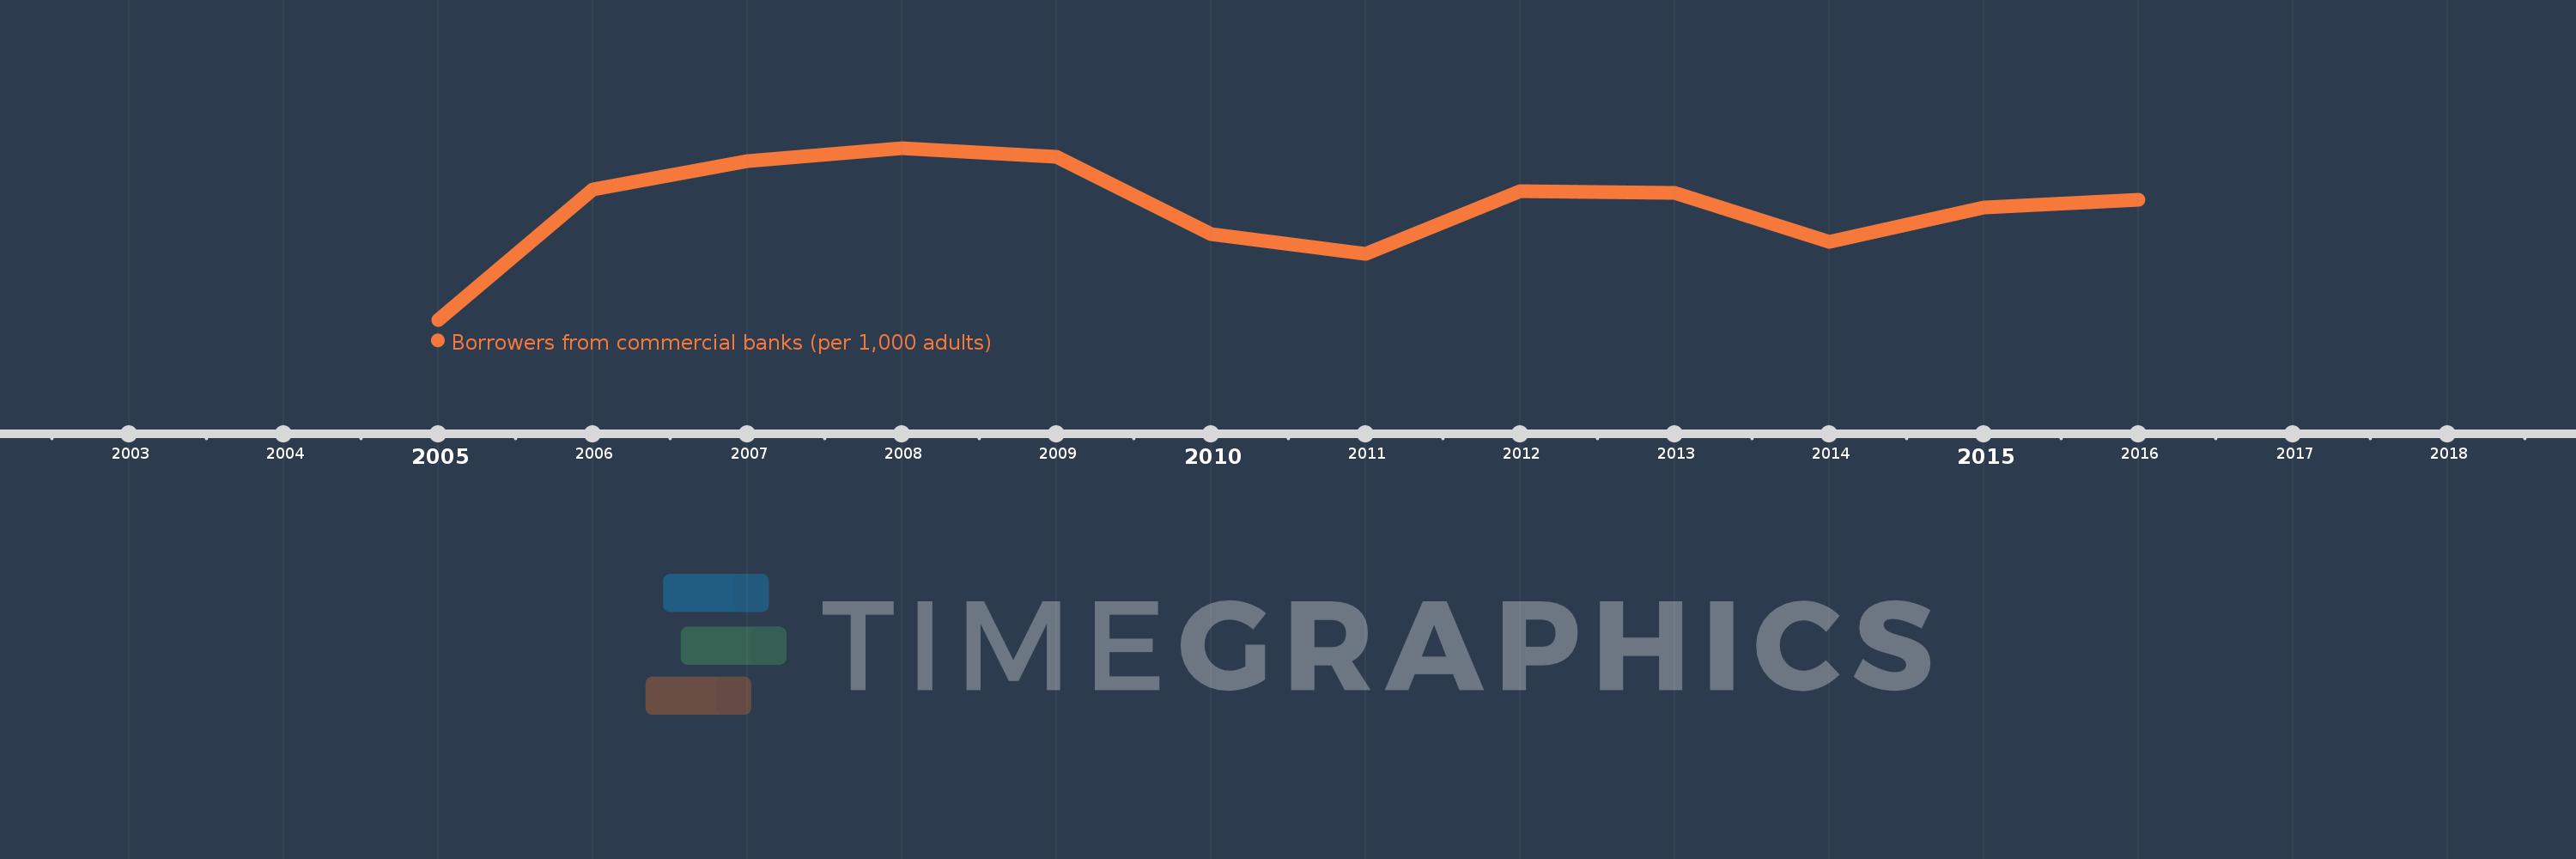
Borrowers from commercial banks (per 1,000 adults)
2016,2015,2014,2013,2012,2011,2010,2009,2008,2007,2006,2005
This statistics in other country:
Timeline:
This timeline shows a graph from 2005 to 2016 of Maldives. No data until 2004. Number of actual observations by date: 12.
Source name:
World Development Indicators
Source organization:
International Monetary Fund, Financial Access Survey.
Categories, topics:
Financial Sector
Last updated:
apr 23, 2017
Indicators value changes by year
Minimum:
73.374
jan 1, 2005
Maximum:
168.824
jan 1, 2008
At the date of observation
Value
Absolute change
Change from previous value
jan 1, 2005
73.374
+73.374
0.0%
jan 1, 2006
145.738
+72.365
98.62%
jan 1, 2007
161.631
+15.892
10.9%
jan 1, 2008
168.824
+7.193
4.45%
jan 1, 2009
164.114
-4.71
-2.79%
jan 1, 2010
121.061
-43.052
-26.23%
jan 1, 2011
109.929
-11.132
-9.2%
jan 1, 2012
144.639
+34.71
31.57%
jan 1, 2013
143.945
-0.694
-0.48%
jan 1, 2014
116.884
-27.061
-18.8%
jan 1, 2015
135.699
+18.815
16.1%
jan 1, 2016
139.81
+4.112
3.03%
Ranking of countries by current statistics by years


Comments: