29
/
en
AIzaSyAYiBZKx7MnpbEhh9jyipgxe19OcubqV5w
April 1, 2024
111921
Costa Rica
CRI
true
2
1
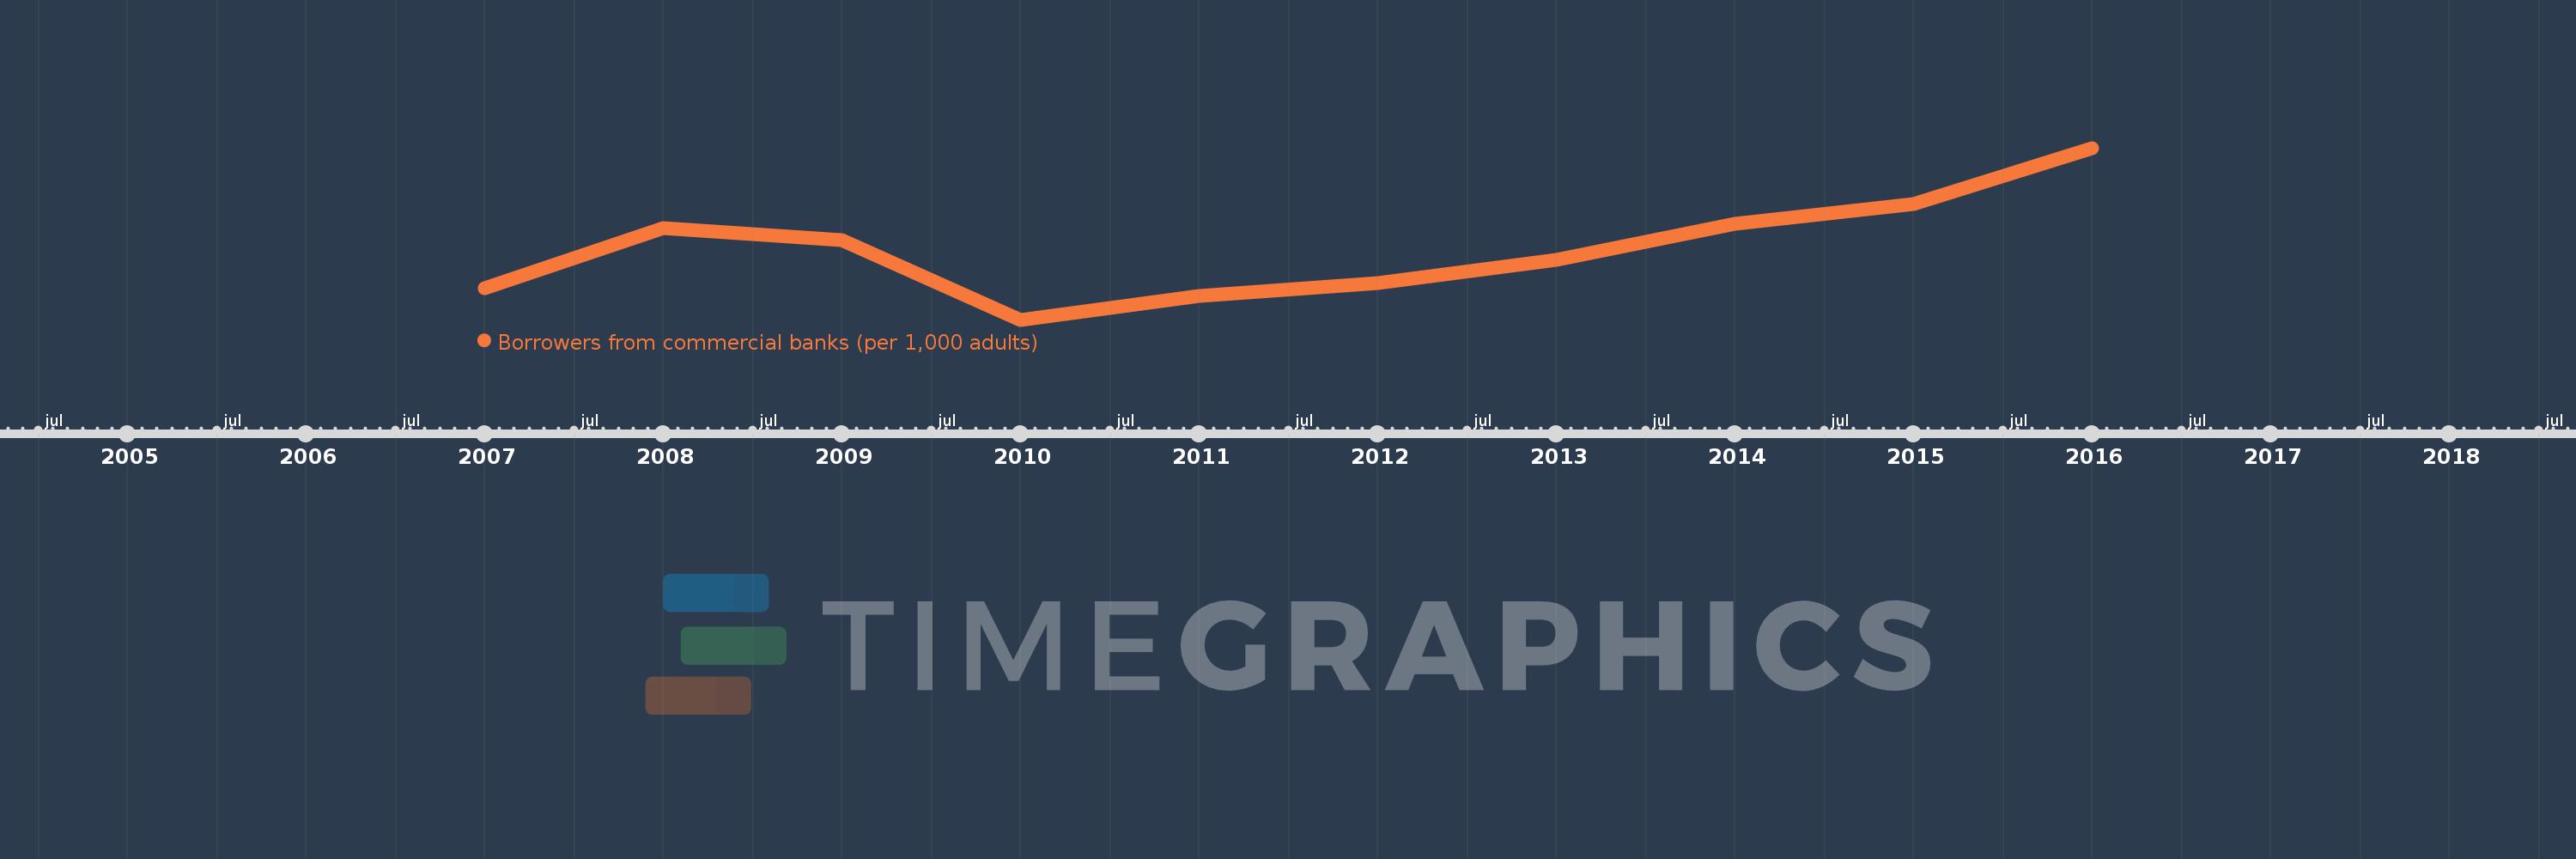
Borrowers from commercial banks (per 1,000 adults)
2016,2015,2014,2013,2012,2011,2010,2009,2008,2007
This statistics in other country:
Timeline:
This timeline shows a graph from 2007 to 2016 of Costa Rica. No data until 2006. Number of actual observations by date: 10.
Source name:
World Development Indicators
Source organization:
International Monetary Fund, Financial Access Survey.
Categories, topics:
Financial Sector
Last updated:
apr 23, 2017
Indicators value changes by year
Minimum:
188.565
jan 1, 2010
Maximum:
227.768
jan 1, 2016
At the date of observation
Value
Absolute change
Change from previous value
jan 1, 2007
195.704
+195.704
0.0%
jan 1, 2008
209.489
+13.785
7.04%
jan 1, 2009
206.796
-2.693
-1.29%
jan 1, 2010
188.565
-18.23
-8.82%
jan 1, 2011
193.95
+5.384
2.86%
jan 1, 2012
197.024
+3.074
1.59%
jan 1, 2013
202.263
+5.239
2.66%
jan 1, 2014
210.38
+8.117
4.01%
jan 1, 2015
214.892
+4.511
2.14%
jan 1, 2016
227.768
+12.876
5.99%
Ranking of countries by current statistics by years


Comments: