29
/
en
AIzaSyAYiBZKx7MnpbEhh9jyipgxe19OcubqV5w
April 1, 2024
114571
Croatia
HRV
true
2
1
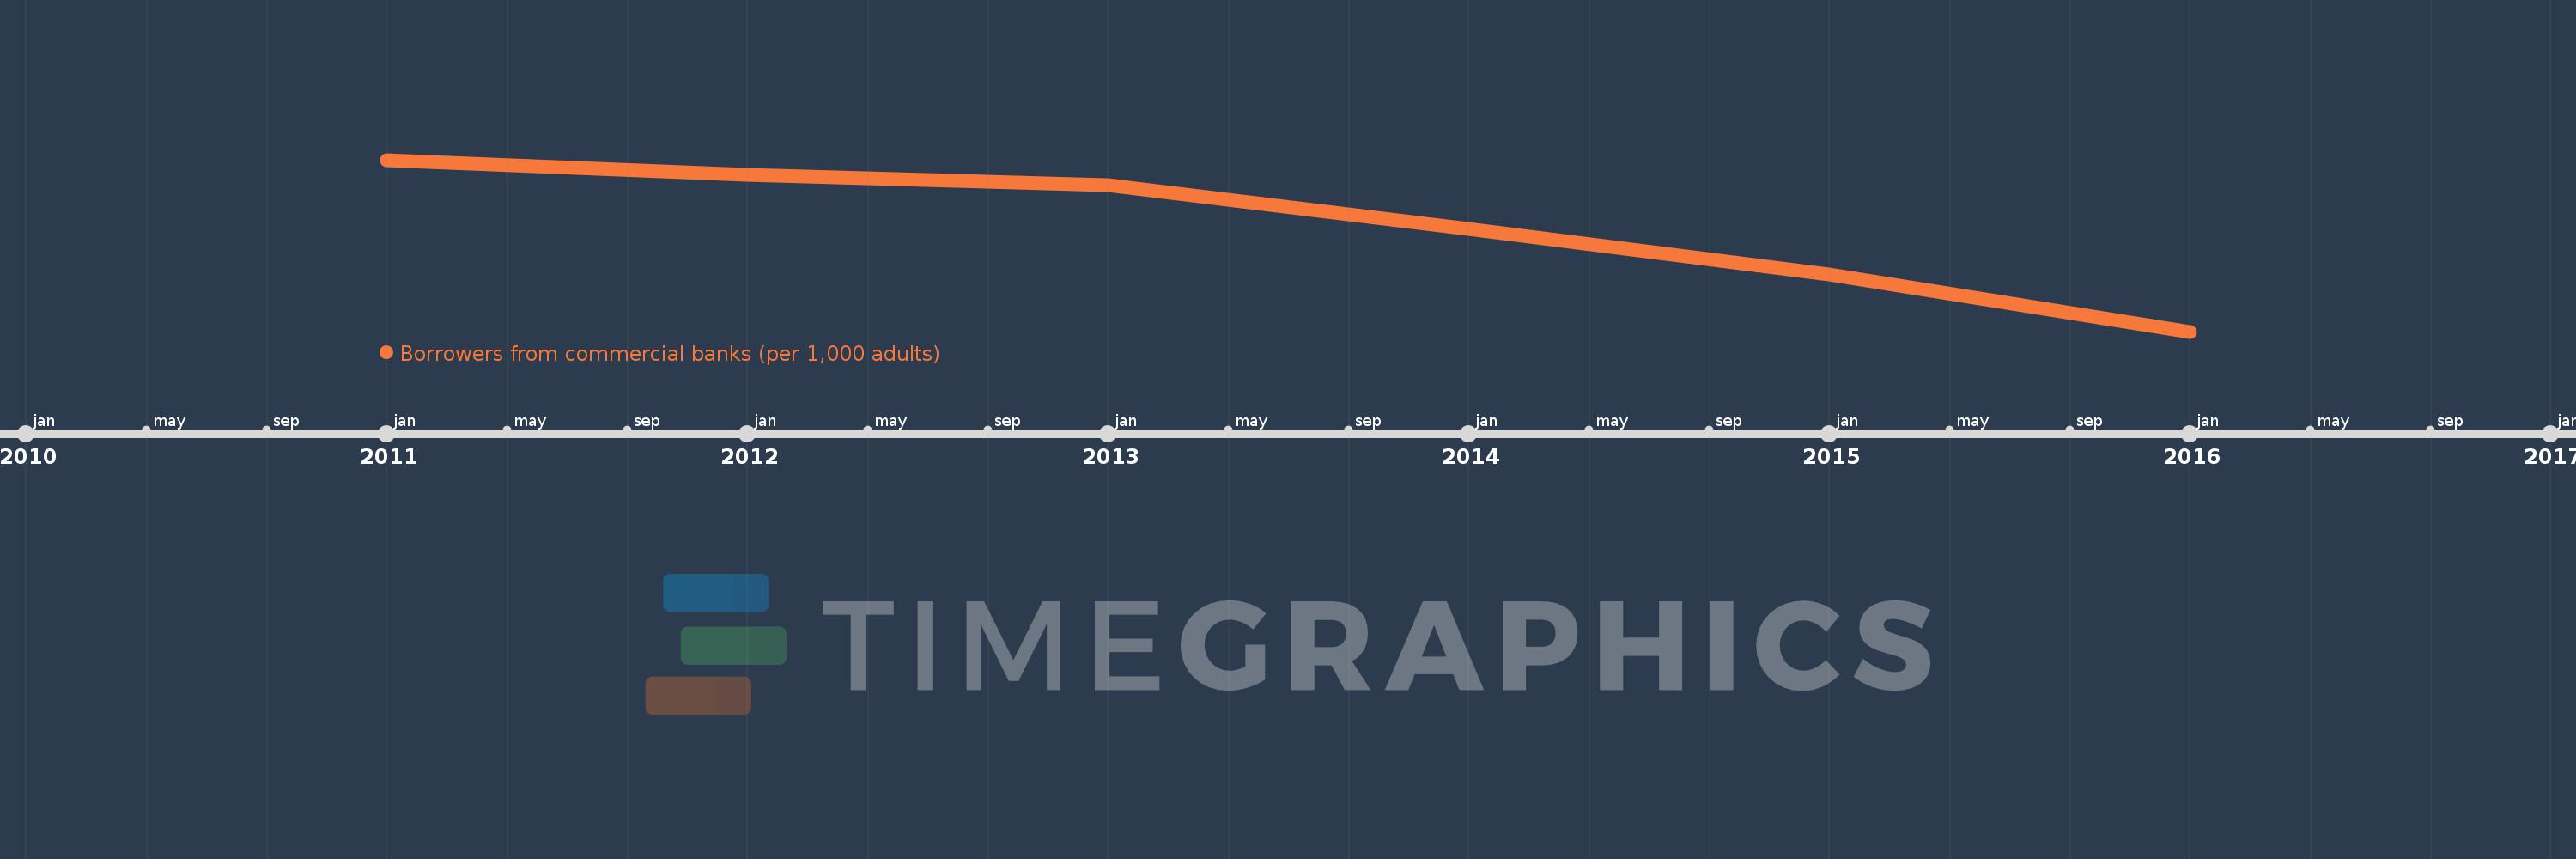
Borrowers from commercial banks (per 1,000 adults)
2016,2015,2014,2013,2012,2011
This statistics in other country:
Timeline:
This timeline shows a graph from 2011 to 2016 of Croatia. No data until 2010. Number of actual observations by date: 6.
Source name:
World Development Indicators
Source organization:
International Monetary Fund, Financial Access Survey.
Categories, topics:
Financial Sector
Last updated:
apr 23, 2017
Indicators value changes by year
Minimum:
602.307
jan 1, 2016
Maximum:
687.651
jan 1, 2011
At the date of observation
Value
Absolute change
Change from previous value
jan 1, 2011
687.651
+687.651
0.0%
jan 1, 2012
680.186
-7.465
-1.09%
jan 1, 2013
674.892
-5.294
-0.78%
jan 1, 2014
653.145
-21.747
-3.22%
jan 1, 2015
630.578
-22.567
-3.46%
jan 1, 2016
602.307
-28.271
-4.48%
Ranking of countries by current statistics by years


Comments: