29
/
en
AIzaSyAYiBZKx7MnpbEhh9jyipgxe19OcubqV5w
April 1, 2024
47947
Middle East & North Africa
MEA
false
2
1
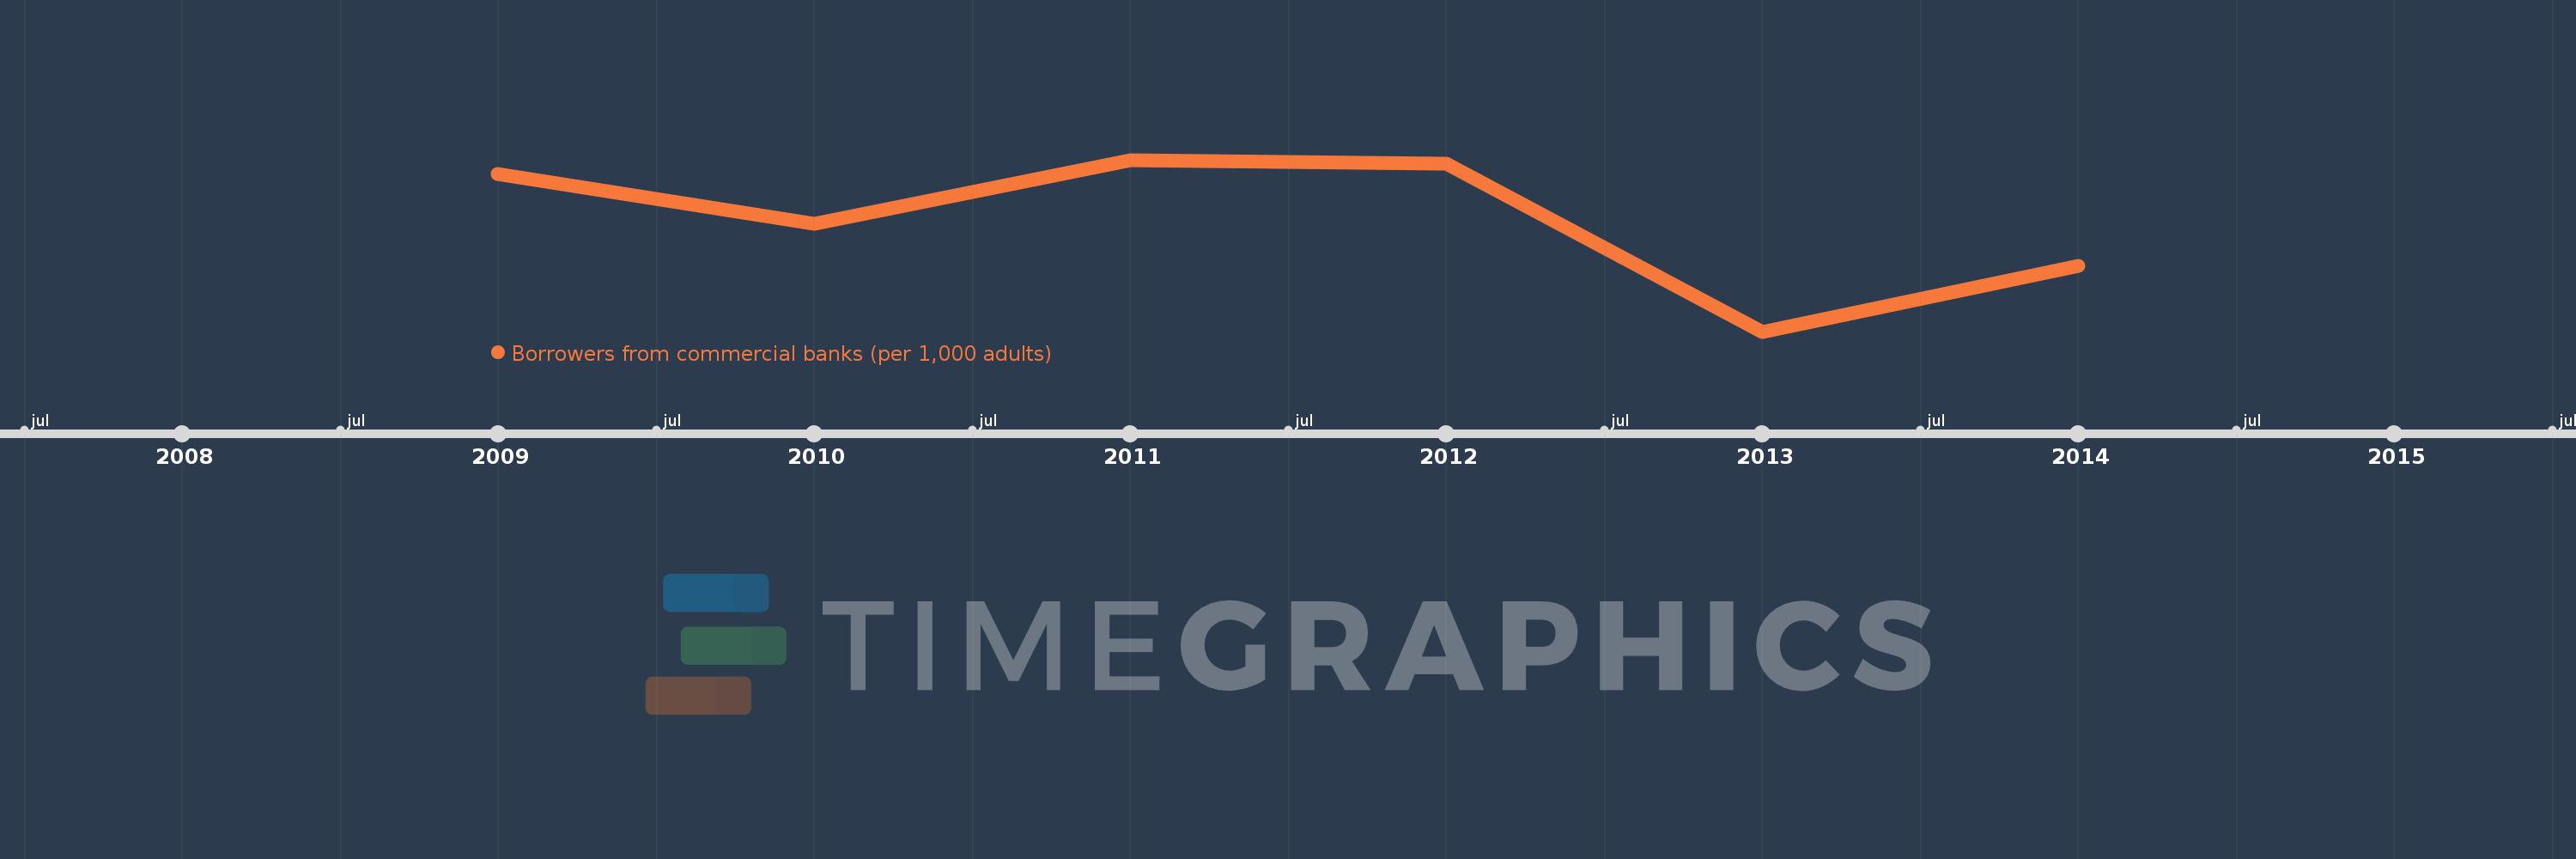
Borrowers from commercial banks (per 1,000 adults)
2014,2013,2012,2011,2010,2009
This statistics in other country:
Timeline:
This timeline shows a graph from 2009 to 2014 of Middle East & North Africa. No data until 2008. Number of actual observations by date: 6.
Source name:
World Development Indicators
Source organization:
International Monetary Fund, Financial Access Survey.
Categories, topics:
Financial Sector
Last updated:
apr 23, 2017
Indicators value changes by year
Minimum:
131.331
jan 1, 2013
Maximum:
154.821
jan 1, 2011
At the date of observation
Value
Absolute change
Change from previous value
jan 1, 2009
152.894
+152.894
0.0%
jan 1, 2010
146.072
-6.822
-4.46%
jan 1, 2011
154.821
+8.749
5.99%
jan 1, 2012
154.273
-0.548
-0.35%
jan 1, 2013
131.331
-22.943
-14.87%
jan 1, 2014
140.341
+9.01
6.86%
Ranking of countries by current statistics by years


Comments: