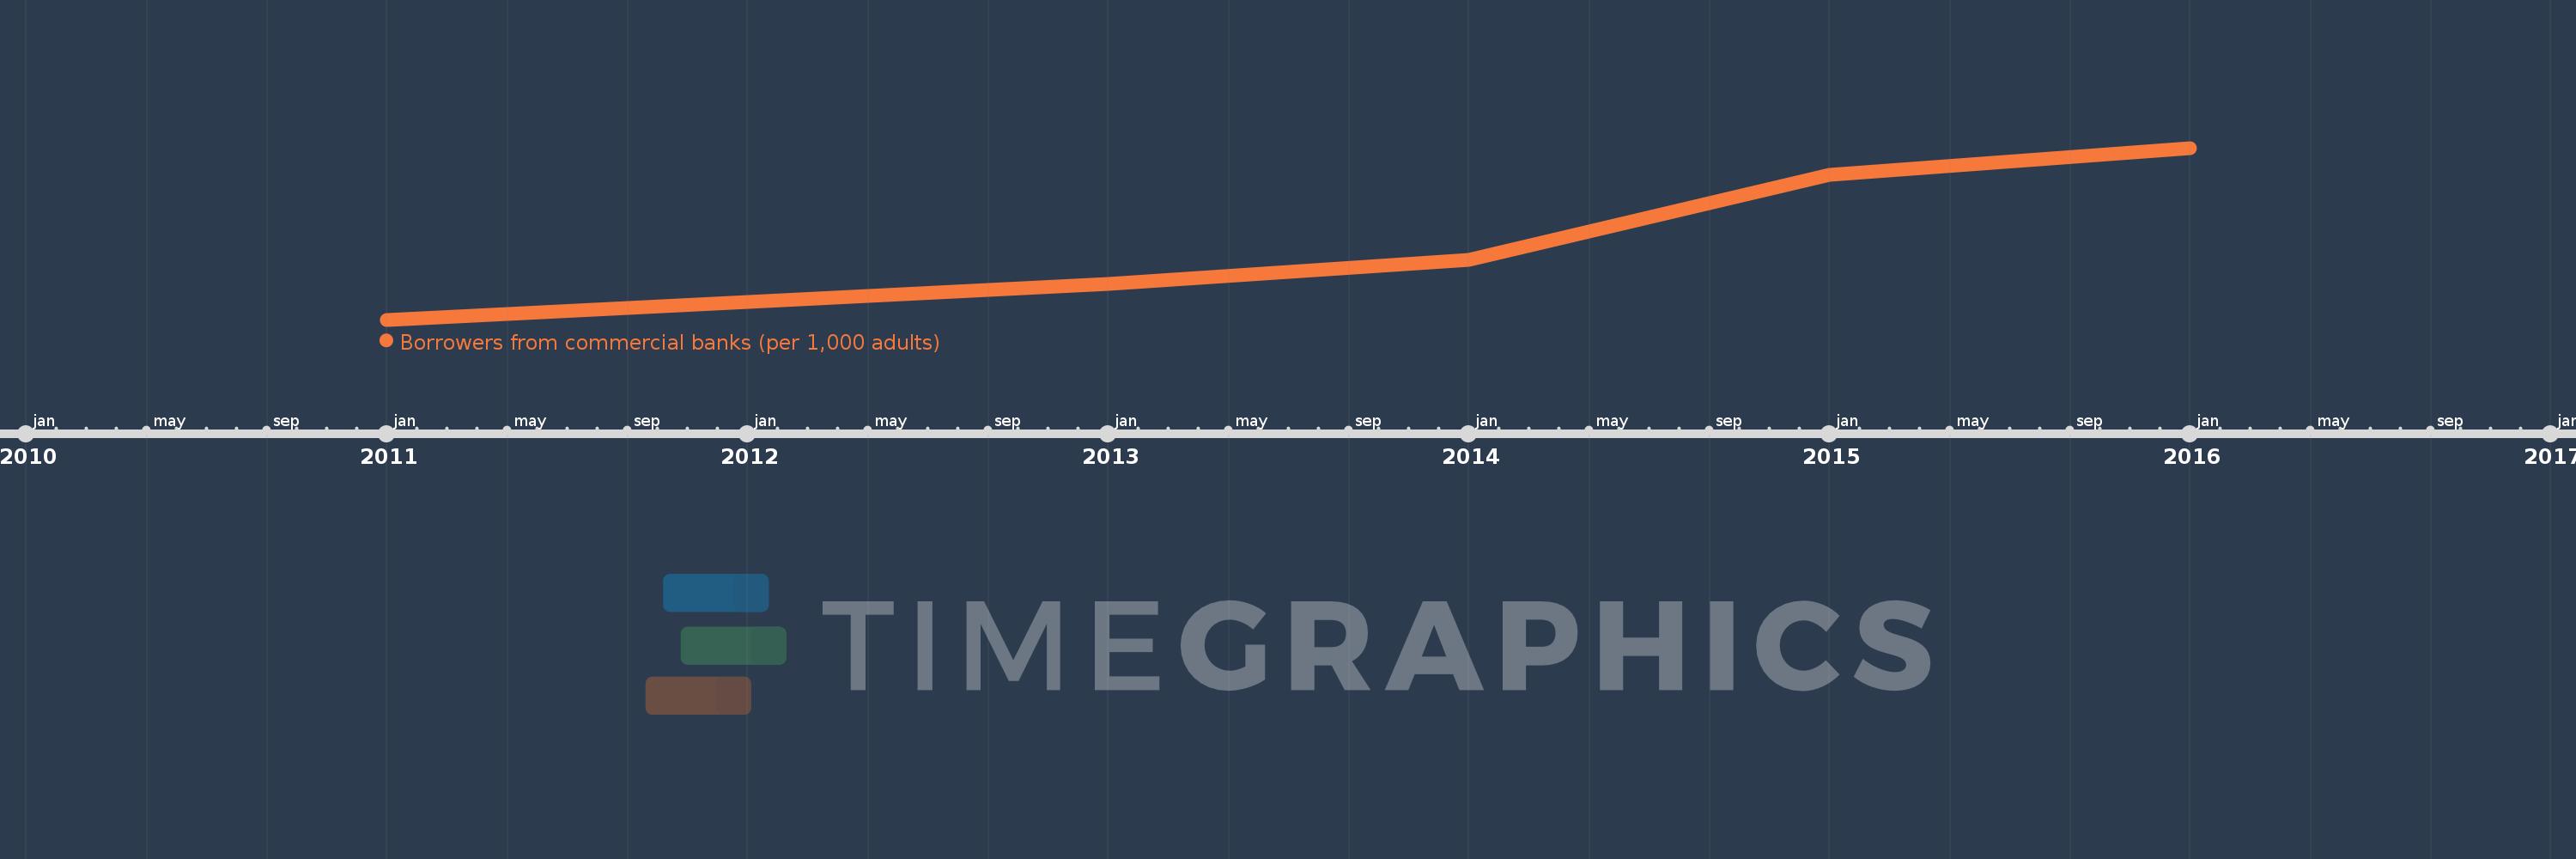
This timeline shows a graph from 2011 to 2016 of Least developed countries: UN classification. No data until 2010. Number of actual observations by date: 5.
Source name:
World Development Indicators
Source organization:
International Monetary Fund, Financial Access Survey.
Categories, topics:
Financial Sector
Last updated:
apr 23, 2017
Indicators value changes by year
Meaning:
18.093
Minimum:
9.37
jan 1, 2011
Maximum:
27.543
jan 1, 2016
At the date of observation
Value
Absolute change
Change from the previous value
jan 1, 2011
9.37
+9.37
0.0%
jan 1, 2013
13.137
+3.767
40.2%
jan 1, 2014
15.686
+2.549
19.4%
jan 1, 2015
24.731
+9.045
57.66%
jan 1, 2016
27.543
+2.812
11.37%
Ranking of countries by current statistics by years
