29
/
en
AIzaSyAYiBZKx7MnpbEhh9jyipgxe19OcubqV5w
April 1, 2024
267687
Tunisia
TUN
true
2
1
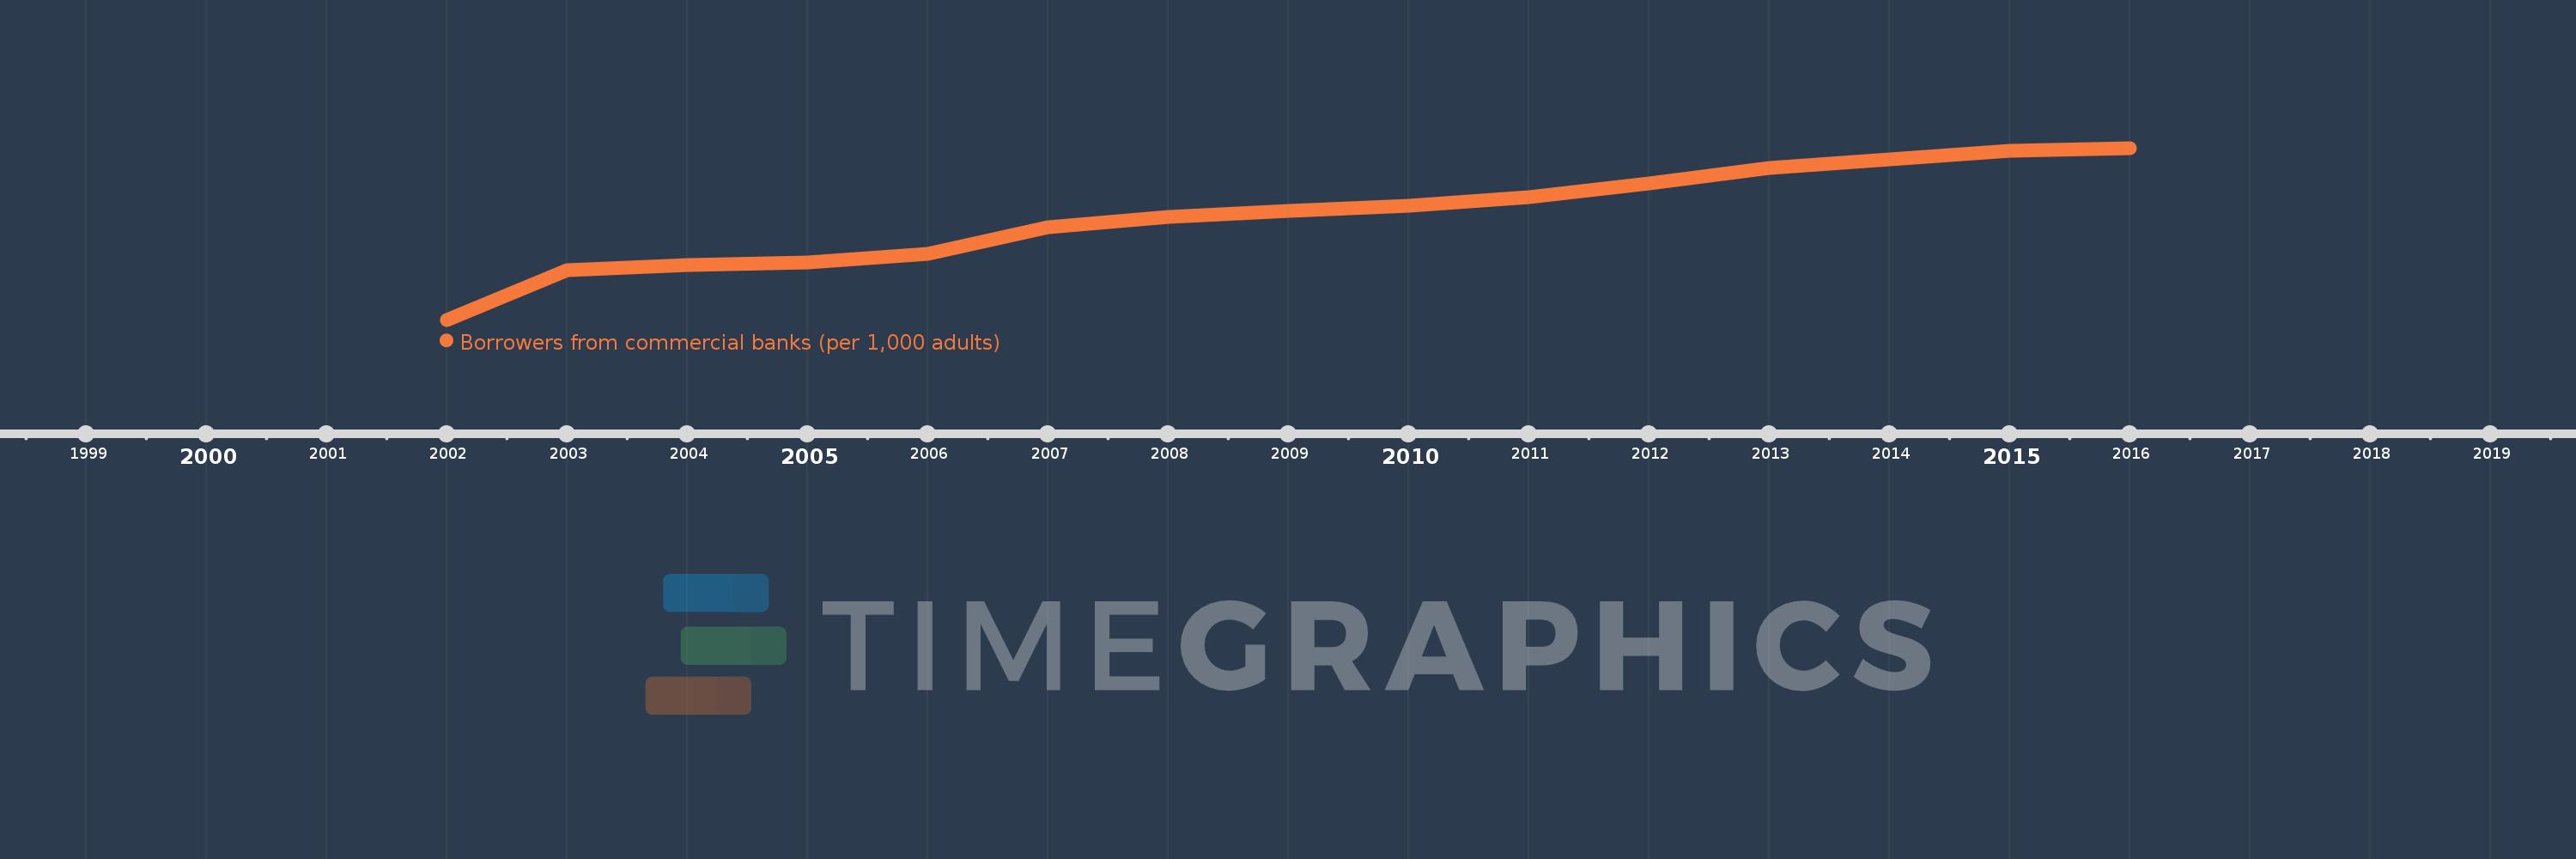
Borrowers from commercial banks (per 1,000 adults)
2016,2015,2014,2013,2012,2011,2010,2009,2008,2007,2006,2005,2004,2003,2002
This statistics in other country:
Timeline:
This timeline shows a graph from 2002 to 2016 of Tunisia. No data until 2001. Number of actual observations by date: 15.
Source name:
World Development Indicators
Source organization:
International Monetary Fund, Financial Access Survey.
Categories, topics:
Financial Sector
Last updated:
apr 23, 2017
Indicators value changes by year
Maximum:
217.688
jan 1, 2016
At the date of observation
Value
Absolute change
Change from previous value
jan 1, 2002
3.579
+3.579
0.0%
jan 1, 2003
65.592
+62.013
1.73K%
jan 1, 2004
72.179
+6.587
10.04%
jan 1, 2005
75.066
+2.887
4.0%
jan 1, 2006
86.18
+11.114
14.81%
jan 1, 2007
118.593
+32.413
37.61%
jan 1, 2008
131.616
+13.023
10.98%
jan 1, 2009
139.688
+8.072
6.13%
jan 1, 2010
145.32
+5.632
4.03%
jan 1, 2011
156.253
+10.933
7.52%
jan 1, 2012
172.946
+16.694
10.68%
jan 1, 2013
192.442
+19.496
11.27%
jan 1, 2014
203.356
+10.914
5.67%
jan 1, 2015
213.897
+10.54
5.18%
jan 1, 2016
217.688
+3.791
1.77%
Ranking of countries by current statistics by years


Comments: