29
/
en
AIzaSyAYiBZKx7MnpbEhh9jyipgxe19OcubqV5w
April 1, 2024
82497
Belize
BLZ
true
2
1
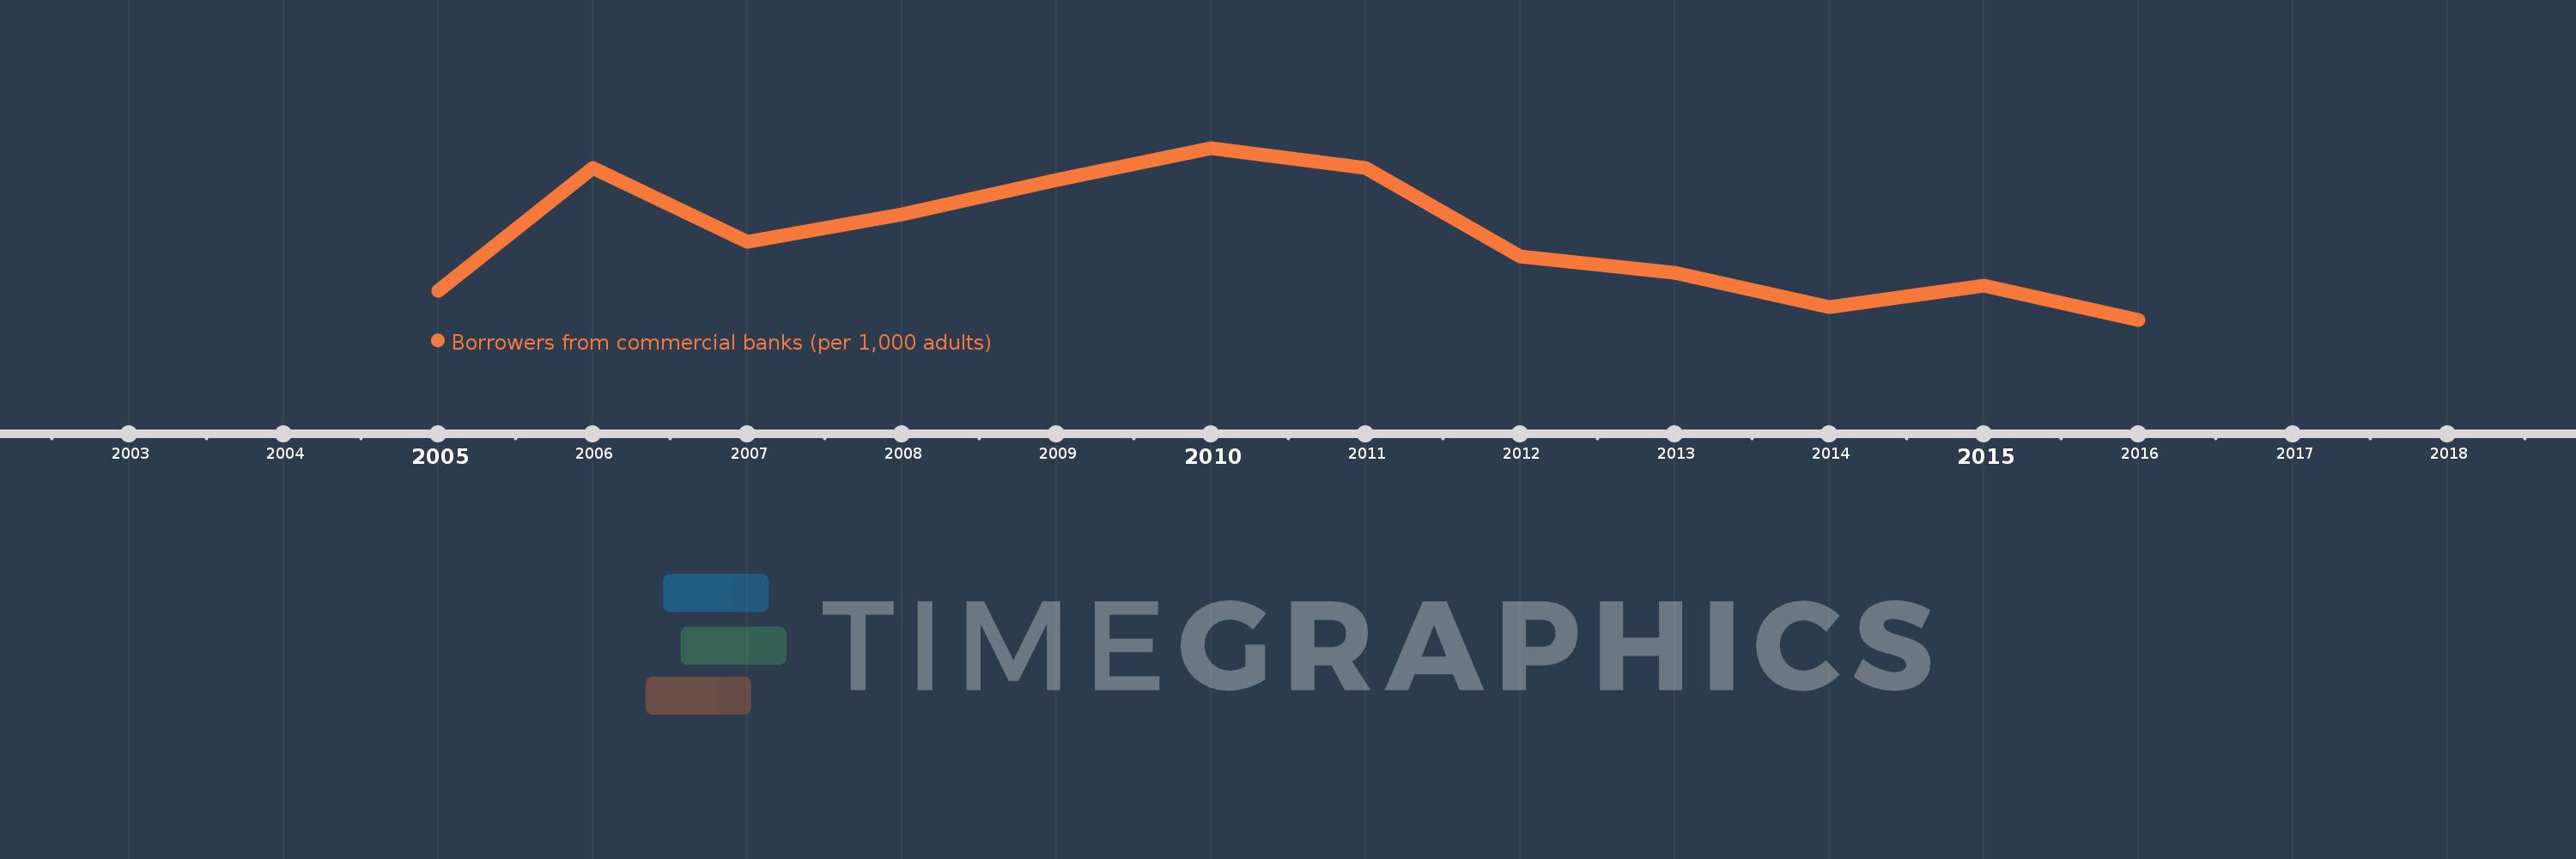
Borrowers from commercial banks (per 1,000 adults)
2016,2015,2014,2013,2012,2011,2010,2009,2008,2007,2006,2005
This statistics in other country:
Timeline:
This timeline shows a graph from 2005 to 2016 of Belize. No data until 2004. Number of actual observations by date: 12.
Source name:
World Development Indicators
Source organization:
International Monetary Fund, Financial Access Survey.
Categories, topics:
Financial Sector
Last updated:
apr 23, 2017
Indicators value changes by year
Minimum:
161.577
jan 1, 2016
Maximum:
343.455
jan 1, 2010
At the date of observation
Value
Absolute change
Change from previous value
jan 1, 2005
192.546
+192.546
0.0%
jan 1, 2006
322.358
+129.812
67.42%
jan 1, 2007
243.658
-78.7
-24.41%
jan 1, 2008
273.282
+29.624
12.16%
jan 1, 2009
309.176
+35.895
13.13%
jan 1, 2010
343.455
+34.279
11.09%
jan 1, 2011
322.048
-21.407
-6.23%
jan 1, 2012
228.905
-93.144
-28.92%
jan 1, 2013
211.749
-17.156
-7.49%
jan 1, 2014
175.334
-36.415
-17.2%
jan 1, 2015
197.556
+22.222
12.67%
jan 1, 2016
161.577
-35.979
-18.21%
Ranking of countries by current statistics by years


Comments: