29
/
en
AIzaSyAYiBZKx7MnpbEhh9jyipgxe19OcubqV5w
April 1, 2024
225646
Portugal
PRT
true
2
1
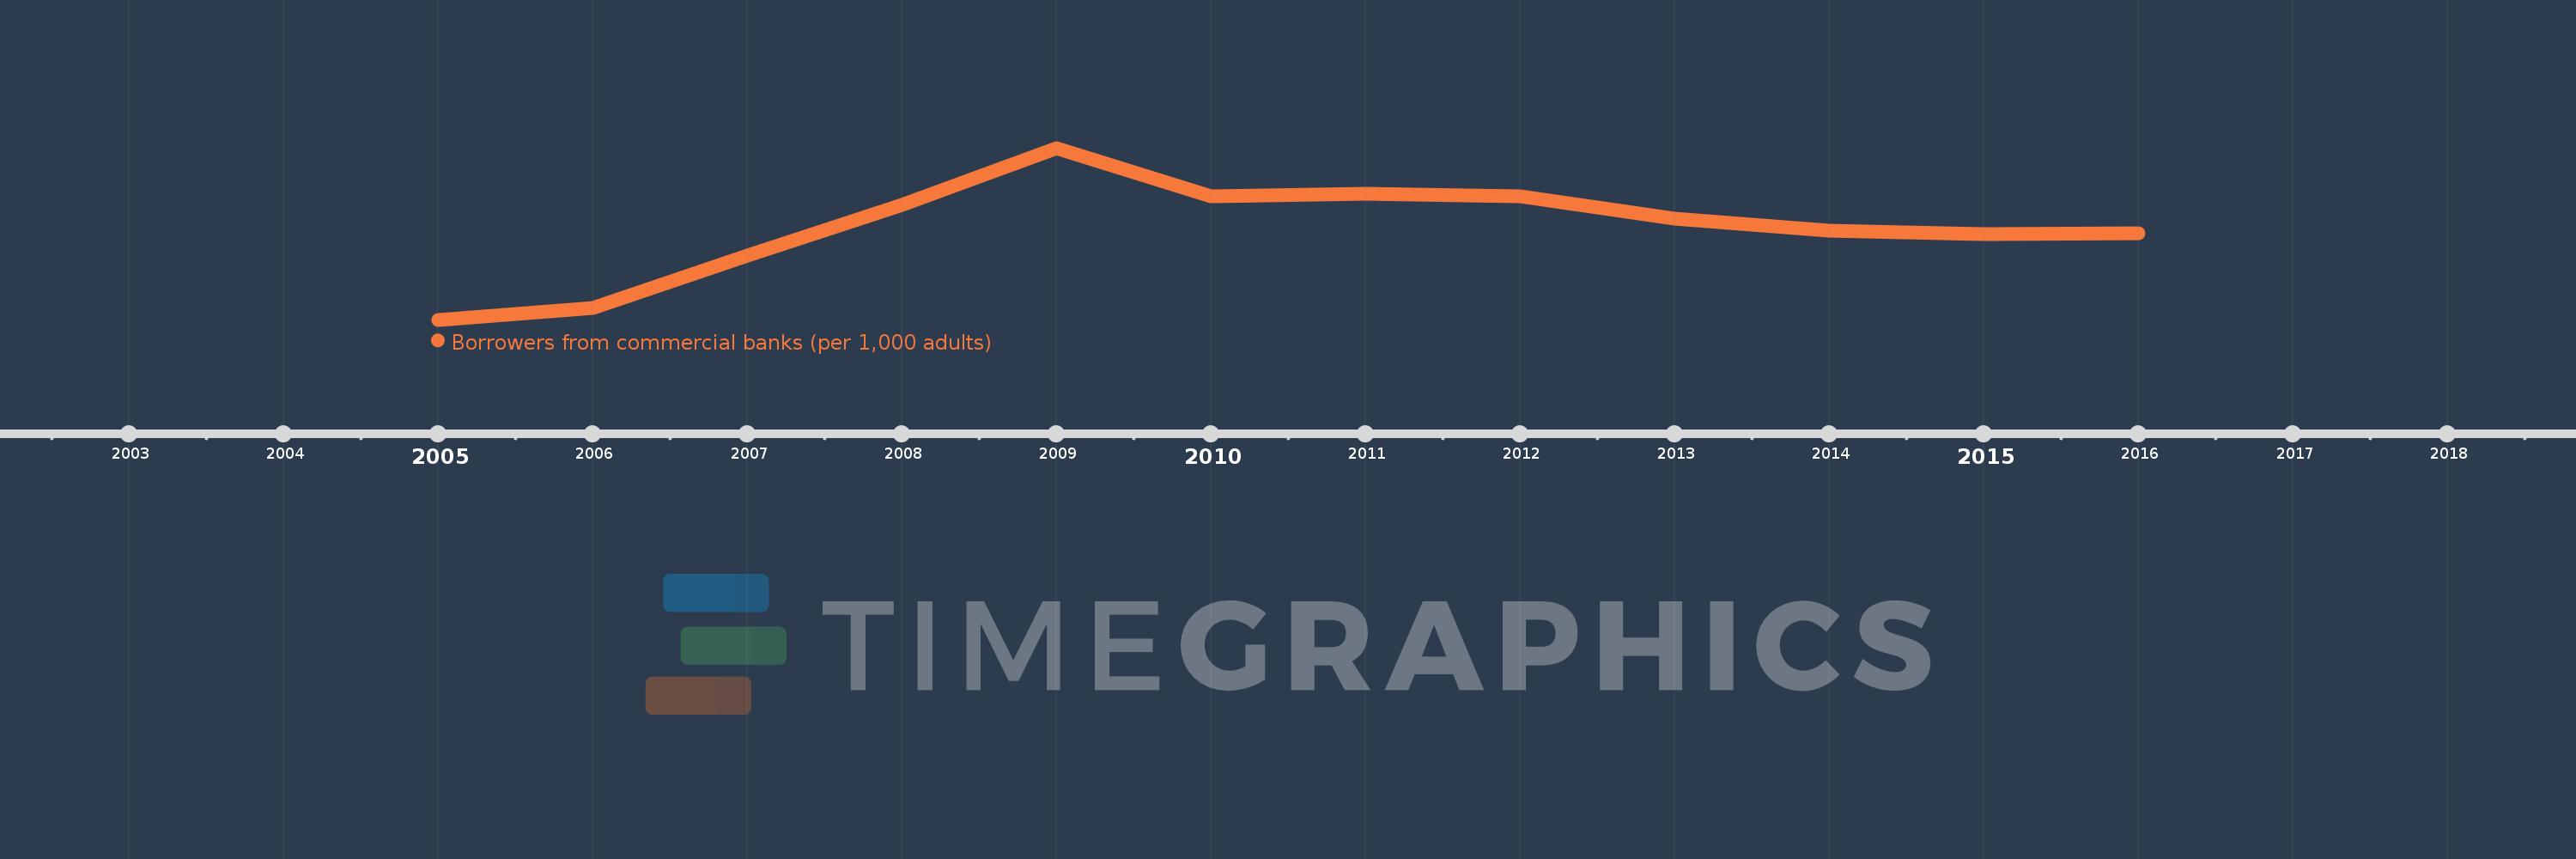
Borrowers from commercial banks (per 1,000 adults)
2016,2015,2014,2013,2012,2011,2010,2009,2008,2007,2006,2005
This statistics in other country:
Timeline:
This timeline shows a graph from 2005 to 2016 of Portugal. No data until 2004. Number of actual observations by date: 12.
Source name:
World Development Indicators
Source organization:
International Monetary Fund, Financial Access Survey.
Categories, topics:
Financial Sector
Last updated:
apr 23, 2017
Indicators value changes by year
Minimum:
328.433
jan 1, 2005
Maximum:
413.73
jan 1, 2009
At the date of observation
Value
Absolute change
Change from previous value
jan 1, 2005
328.433
+328.433
0.0%
jan 1, 2006
334.432
+5.999
1.83%
jan 1, 2007
360.18
+25.748
7.7%
jan 1, 2008
385.398
+25.218
7.0%
jan 1, 2009
413.73
+28.332
7.35%
jan 1, 2010
389.585
-24.145
-5.84%
jan 1, 2011
391.17
+1.585
0.41%
jan 1, 2012
389.506
-1.663
-0.43%
jan 1, 2013
378.598
-10.908
-2.8%
jan 1, 2014
372.756
-5.842
-1.54%
jan 1, 2015
371.011
-1.745
-0.47%
jan 1, 2016
371.203
+0.192
0.05%
Ranking of countries by current statistics by years


Comments: