29
/
en
AIzaSyAYiBZKx7MnpbEhh9jyipgxe19OcubqV5w
April 1, 2024
161242
Italy
ITA
true
2
1
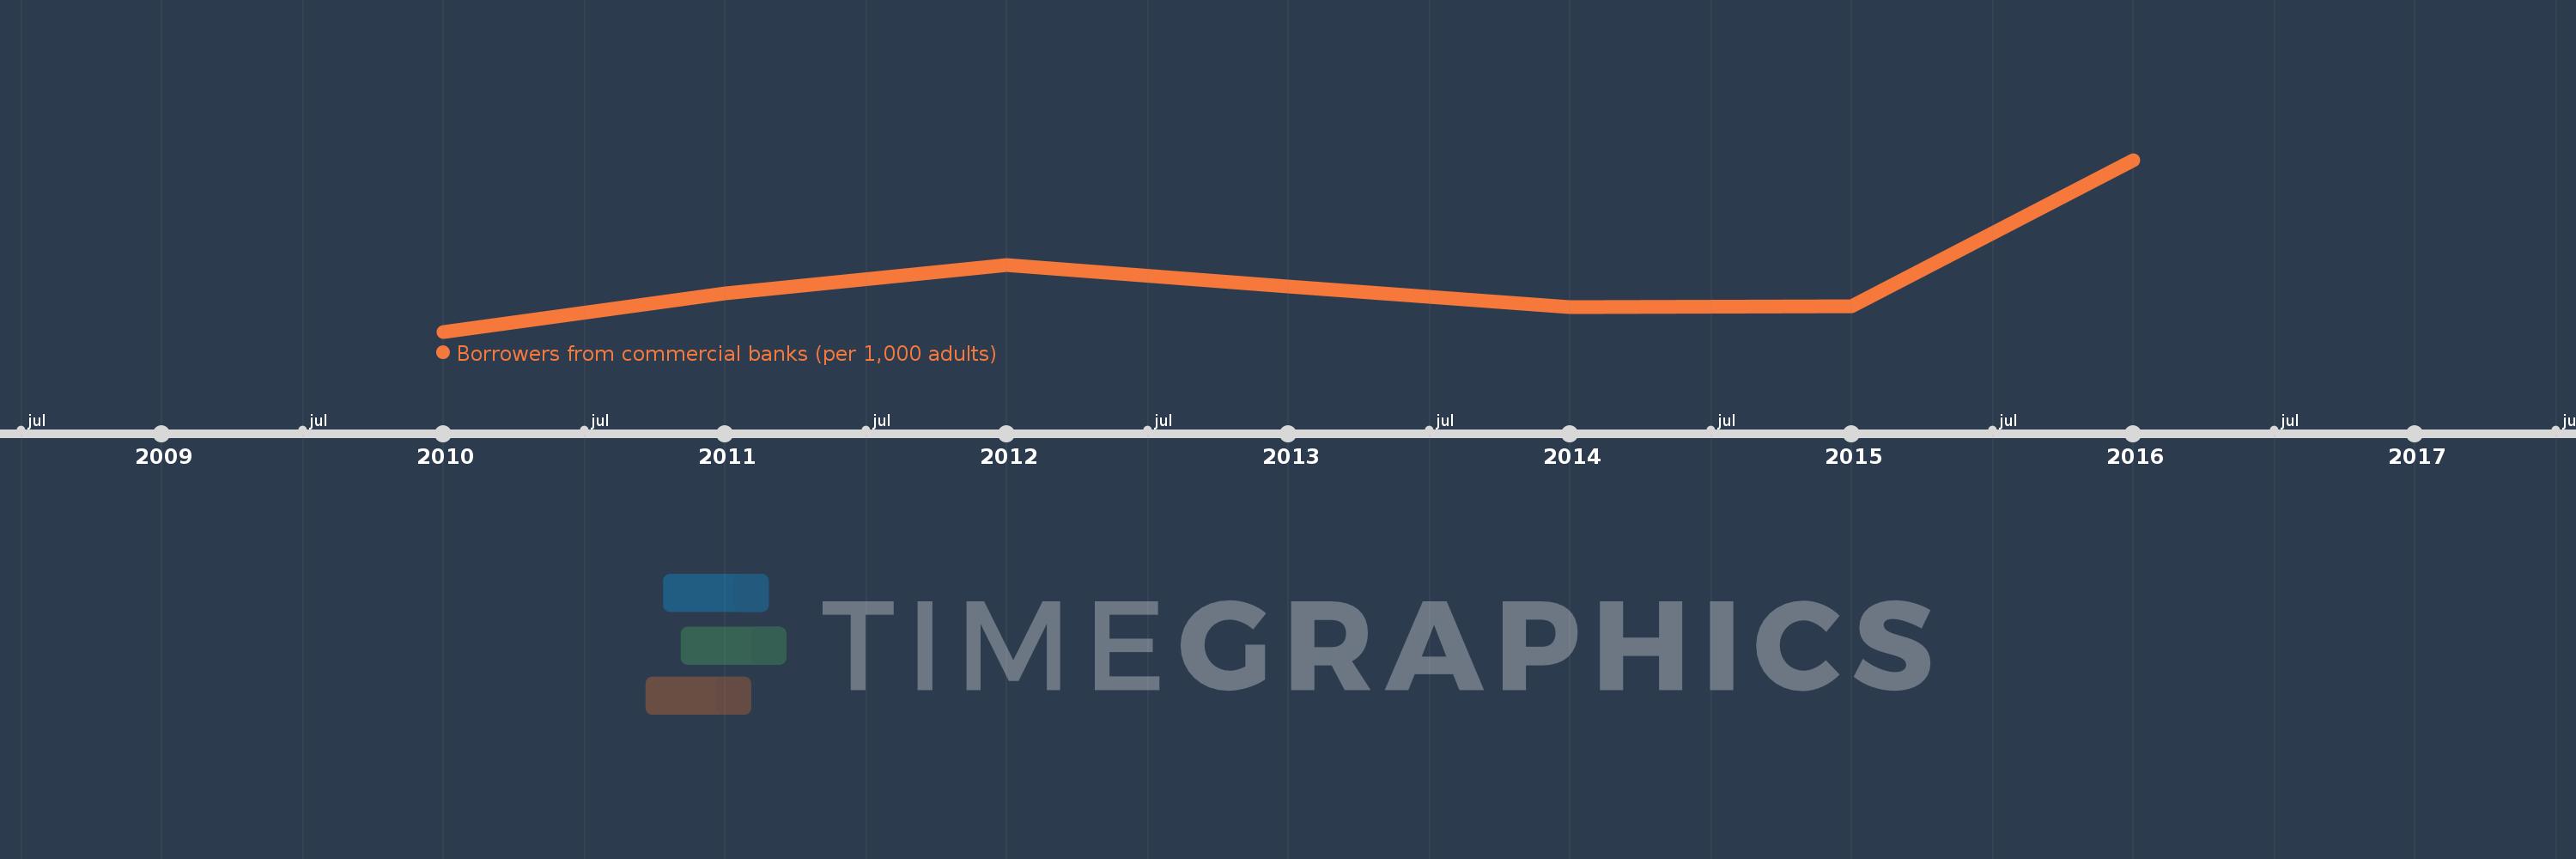
Borrowers from commercial banks (per 1,000 adults)
2016,2015,2014,2013,2012,2011,2010
This statistics in other country:
Timeline:
This timeline shows a graph from 2010 to 2016 of Italy. No data until 2009. Number of actual observations by date: 7.
Source name:
World Development Indicators
Source organization:
International Monetary Fund, Financial Access Survey.
Categories, topics:
Financial Sector
Last updated:
apr 23, 2017
Indicators value changes by year
Minimum:
447.585
jan 1, 2010
Maximum:
533.862
jan 1, 2016
At the date of observation
Value
Absolute change
Change from previous value
jan 1, 2010
447.585
+447.585
0.0%
jan 1, 2011
466.748
+19.163
4.28%
jan 1, 2012
480.819
+14.071
3.01%
jan 1, 2013
470.231
-10.588
-2.2%
jan 1, 2014
459.819
-10.412
-2.21%
jan 1, 2015
460.422
+0.604
0.13%
jan 1, 2016
533.862
+73.44
15.95%
Ranking of countries by current statistics by years


Comments: