29
/
en
AIzaSyAYiBZKx7MnpbEhh9jyipgxe19OcubqV5w
April 1, 2024
106916
Colombia
COL
true
2
1
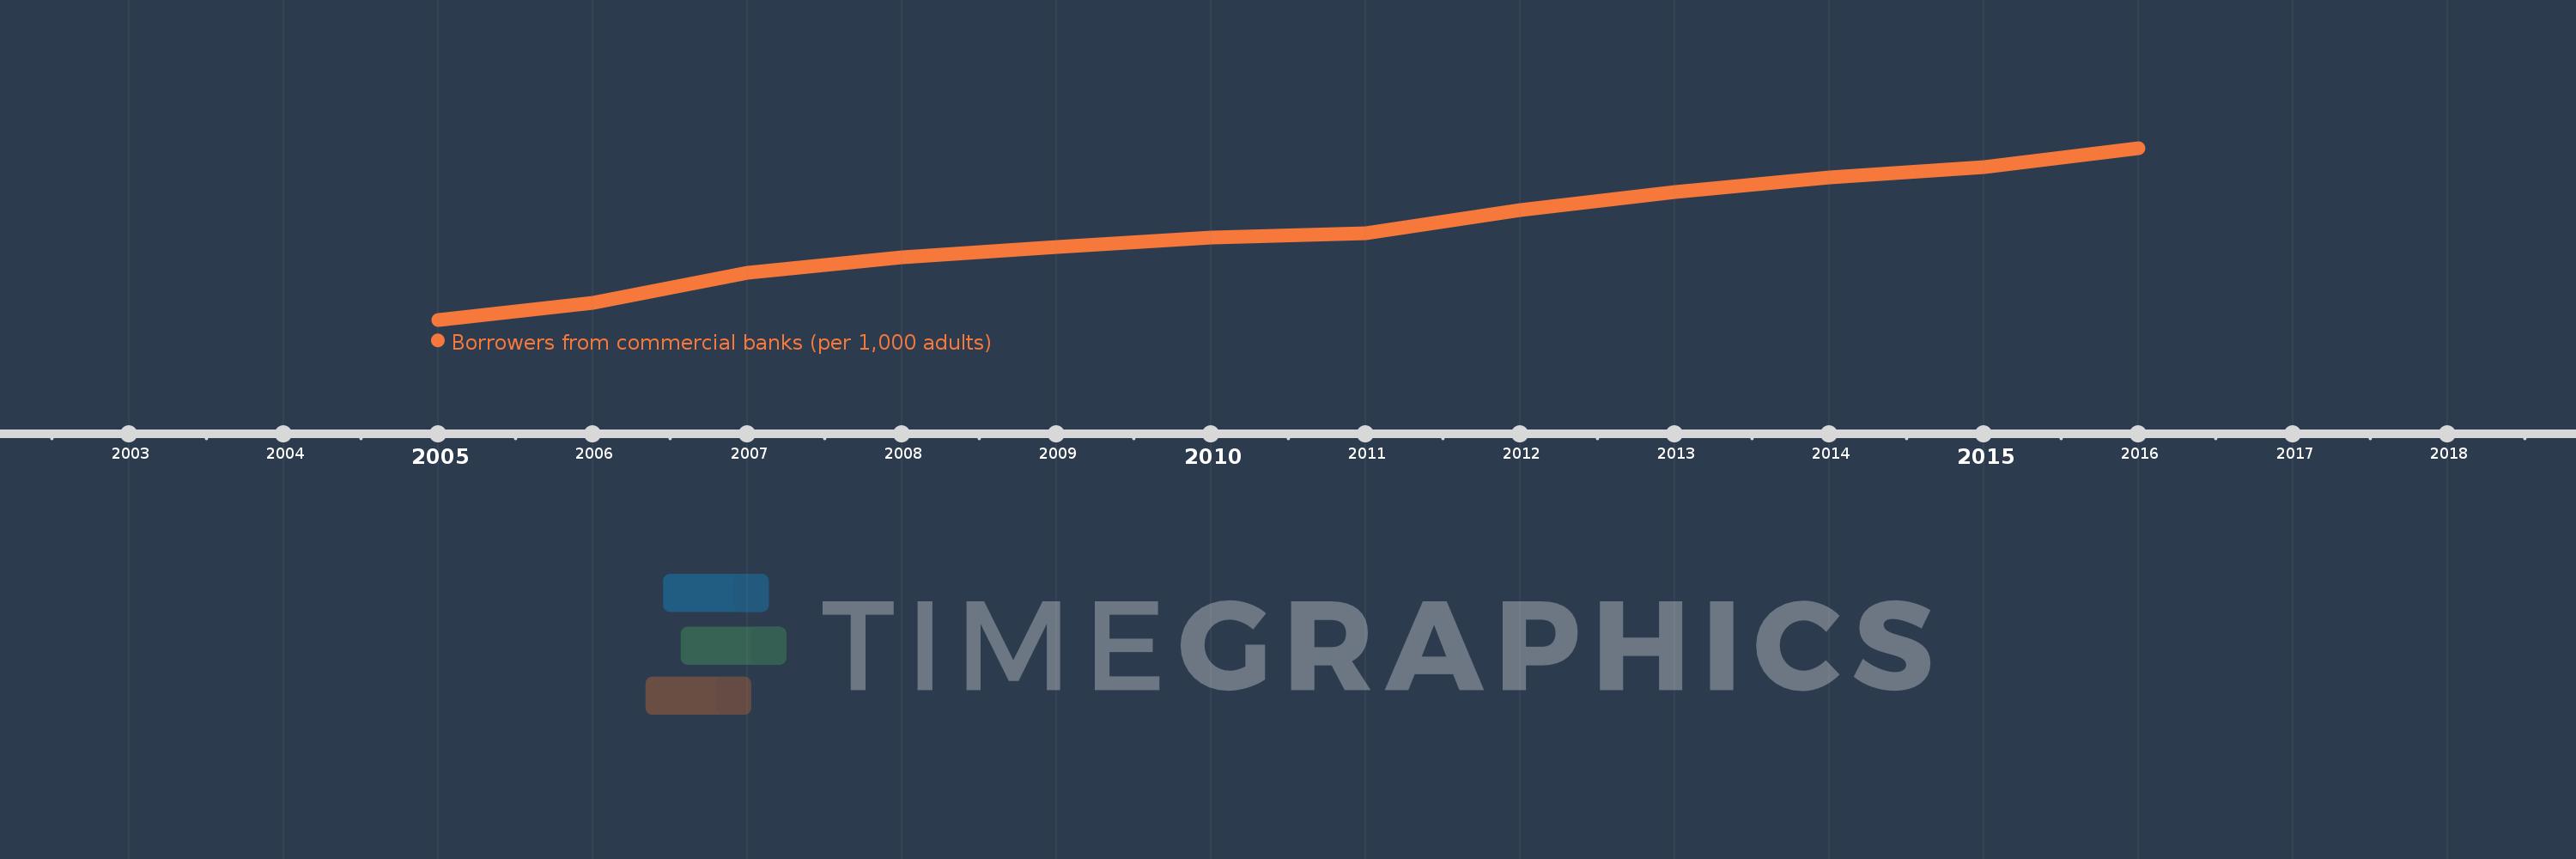
Borrowers from commercial banks (per 1,000 adults)
2016,2015,2014,2013,2012,2011,2010,2009,2008,2007,2006,2005
This statistics in other country:
Timeline:
This timeline shows a graph from 2005 to 2016 of Colombia. No data until 2004. Number of actual observations by date: 12.
Source name:
World Development Indicators
Source organization:
International Monetary Fund, Financial Access Survey.
Categories, topics:
Financial Sector
Last updated:
apr 23, 2017
Indicators value changes by year
Minimum:
99.182
jan 1, 2005
Maximum:
230.619
jan 1, 2016
At the date of observation
Value
Absolute change
Change from previous value
jan 1, 2005
99.182
+99.182
0.0%
jan 1, 2006
111.854
+12.672
12.78%
jan 1, 2007
134.875
+23.021
20.58%
jan 1, 2008
146.978
+12.103
8.97%
jan 1, 2009
154.936
+7.957
5.41%
jan 1, 2010
161.84
+6.904
4.46%
jan 1, 2011
165.117
+3.277
2.03%
jan 1, 2012
183.339
+18.222
11.04%
jan 1, 2013
196.883
+13.544
7.39%
jan 1, 2014
208.235
+11.353
5.77%
jan 1, 2015
215.819
+7.584
3.64%
jan 1, 2016
230.619
+14.799
6.86%
Ranking of countries by current statistics by years


Comments: