29
/
en
AIzaSyAYiBZKx7MnpbEhh9jyipgxe19OcubqV5w
April 1, 2024
277386
Uruguay
URY
true
2
1
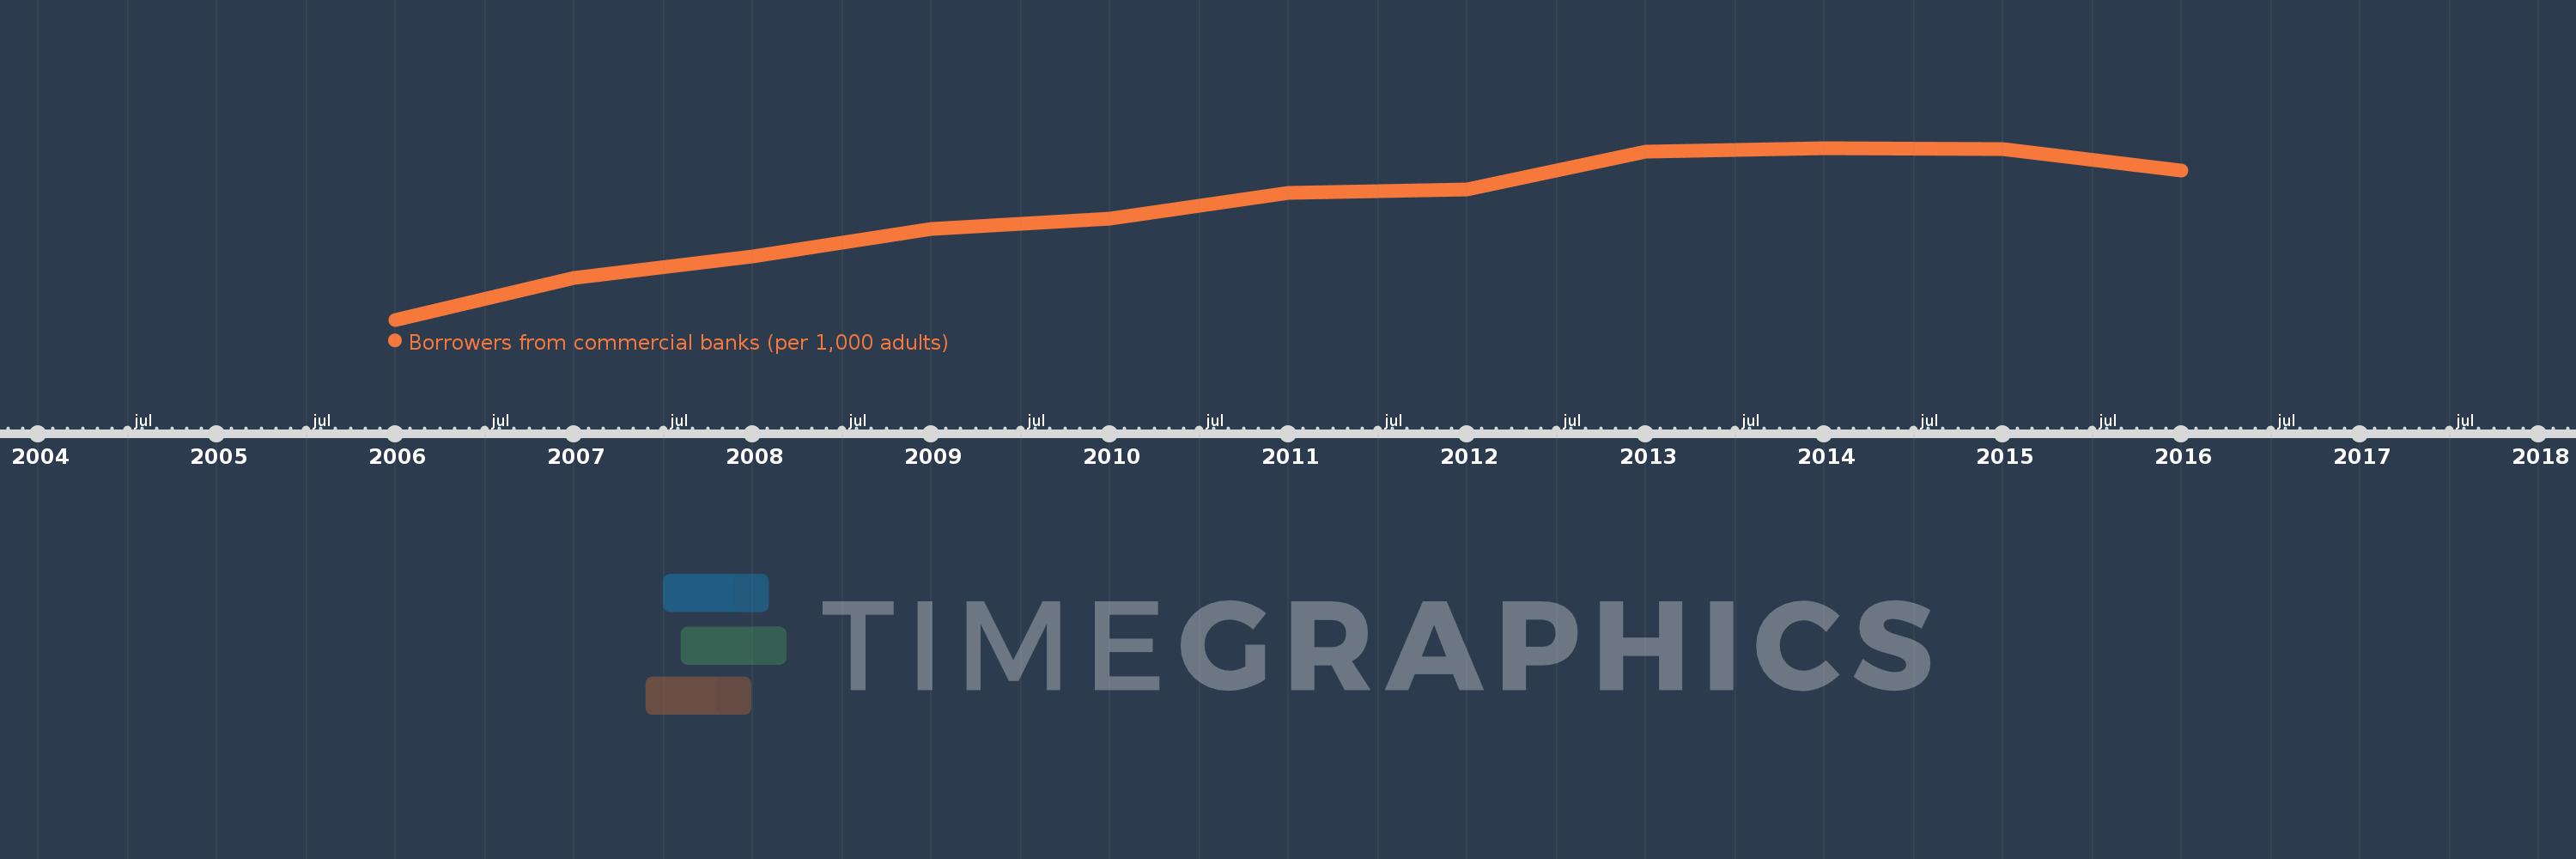
Borrowers from commercial banks (per 1,000 adults)
2016,2015,2014,2013,2012,2011,2010,2009,2008,2007,2006
This statistics in other country:
Timeline:
This timeline shows a graph from 2006 to 2016 of Uruguay. No data until 2005. Number of actual observations by date: 11.
Source name:
World Development Indicators
Source organization:
International Monetary Fund, Financial Access Survey.
Categories, topics:
Financial Sector
Last updated:
apr 23, 2017
Indicators value changes by year
Minimum:
219.614
jan 1, 2006
Maximum:
567.459
jan 1, 2014
At the date of observation
Value
Absolute change
Change from previous value
jan 1, 2006
219.614
+219.614
0.0%
jan 1, 2007
304.468
+84.854
38.64%
jan 1, 2008
347.87
+43.402
14.26%
jan 1, 2009
402.621
+54.751
15.74%
jan 1, 2010
424.069
+21.447
5.33%
jan 1, 2011
476.196
+52.128
12.29%
jan 1, 2012
482.599
+6.403
1.34%
jan 1, 2013
560.811
+78.212
16.21%
jan 1, 2014
567.459
+6.648
1.19%
jan 1, 2015
564.563
-2.896
-0.51%
jan 1, 2016
521.912
-42.651
-7.55%
Ranking of countries by current statistics by years


Comments: