29
/
en
AIzaSyAYiBZKx7MnpbEhh9jyipgxe19OcubqV5w
April 1, 2024
135250
Gabon
GAB
true
2
1
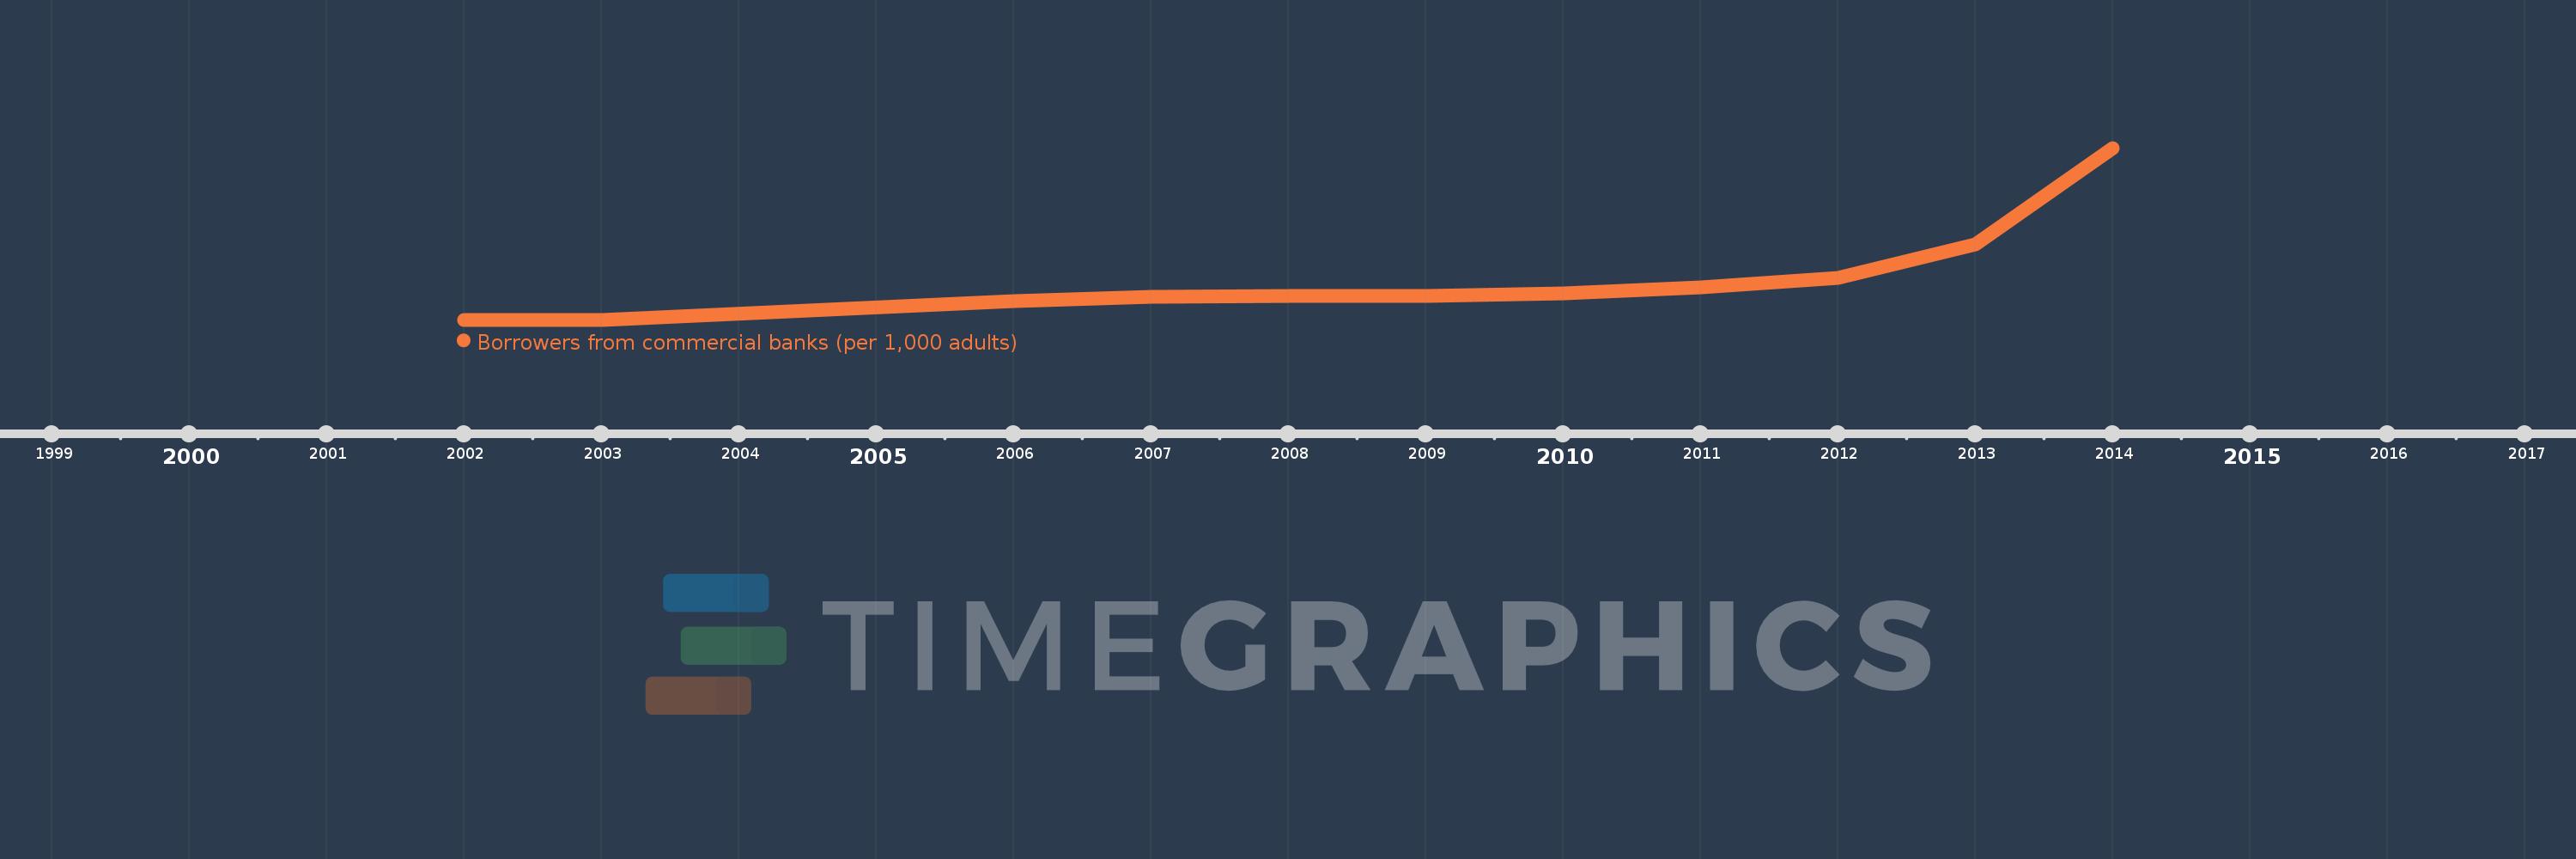
Borrowers from commercial banks (per 1,000 adults)
2014,2013,2012,2011,2010,2009,2008,2007,2006,2003,2002
This statistics in other country:
Timeline:
This timeline shows a graph from 2002 to 2014 of Gabon. No data until 2001. Number of actual observations by date: 11.
Source name:
World Development Indicators
Source organization:
International Monetary Fund, Financial Access Survey.
Categories, topics:
Financial Sector
Last updated:
apr 23, 2017
Indicators value changes by year
Maximum:
107.895
jan 1, 2014
At the date of observation
Value
Absolute change
Change from previous value
jan 1, 2002
1.384
+1.384
0.0%
jan 1, 2003
1.283
-0.101
-7.31%
jan 1, 2006
12.839
+11.557
900.8%
jan 1, 2007
15.347
+2.507
19.53%
jan 1, 2008
16.044
+0.697
4.54%
jan 1, 2009
16.312
+0.268
1.67%
jan 1, 2010
17.417
+1.105
6.77%
jan 1, 2011
21.595
+4.178
23.99%
jan 1, 2012
27.497
+5.902
27.33%
jan 1, 2013
47.896
+20.399
74.19%
jan 1, 2014
107.895
+59.999
125.27%
Ranking of countries by current statistics by years


Comments: