Download This statistics in other country:
Timeline:
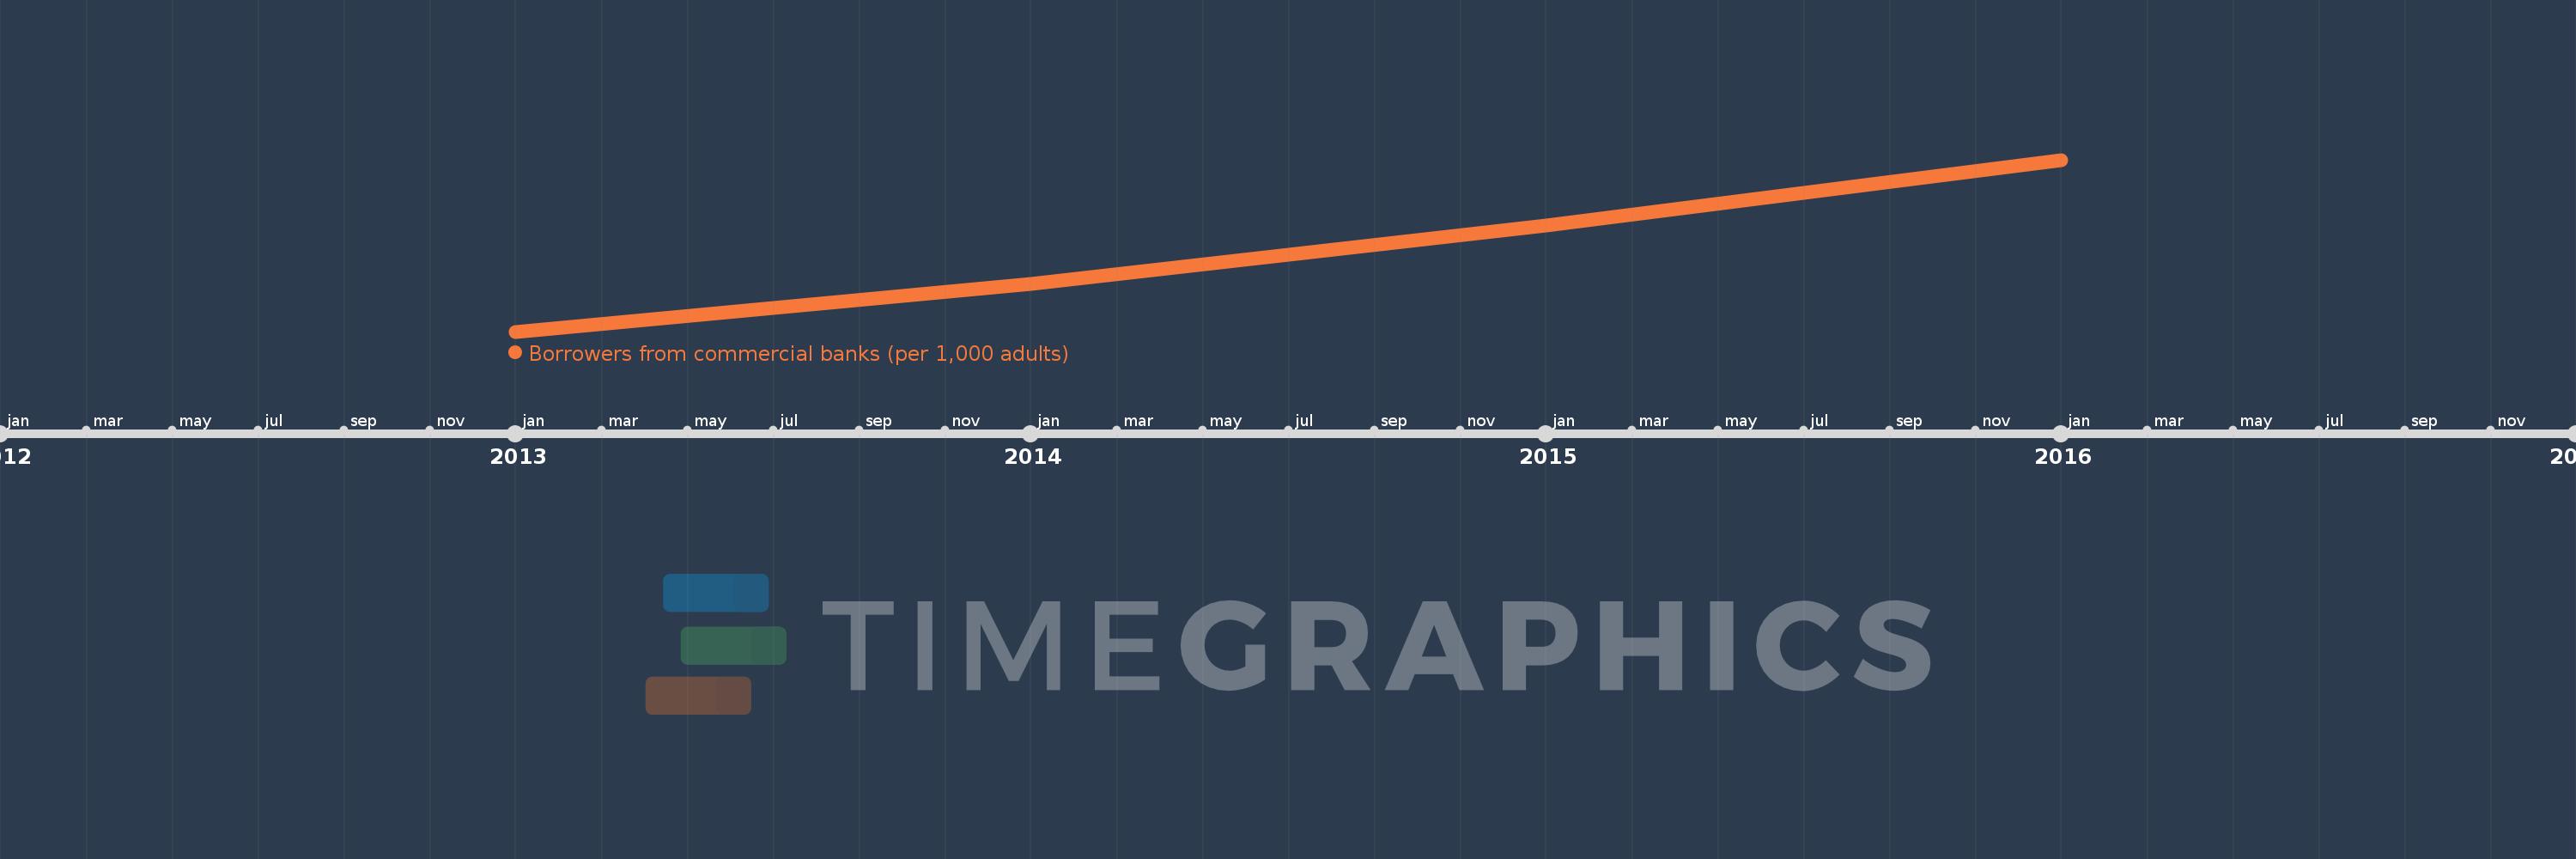
This timeline shows a graph from 2013 to 2016 of China. No data until 2012. Number of actual observations by date: 4.
Source name:
World Development Indicators
Source organization:
International Monetary Fund, Financial Access Survey.
Categories, topics:
Financial Sector
Last updated:
apr 23, 2017
Indicators value changes by year
Minimum:
268.901
jan 1, 2013
Maximum:
342.551
jan 1, 2016
At the date of observation
Value
Absolute change
Change from the previous value
jan 1, 2013
268.901
+268.901
0.0%
jan 1, 2014
289.488
+20.587
7.66%
jan 1, 2015
314.462
+24.974
8.63%
jan 1, 2016
342.551
+28.09
8.93%
Ranking of countries by current statistics by years
