29
/
en
AIzaSyAYiBZKx7MnpbEhh9jyipgxe19OcubqV5w
April 1, 2024
240237
Singapore
SGP
true
2
1
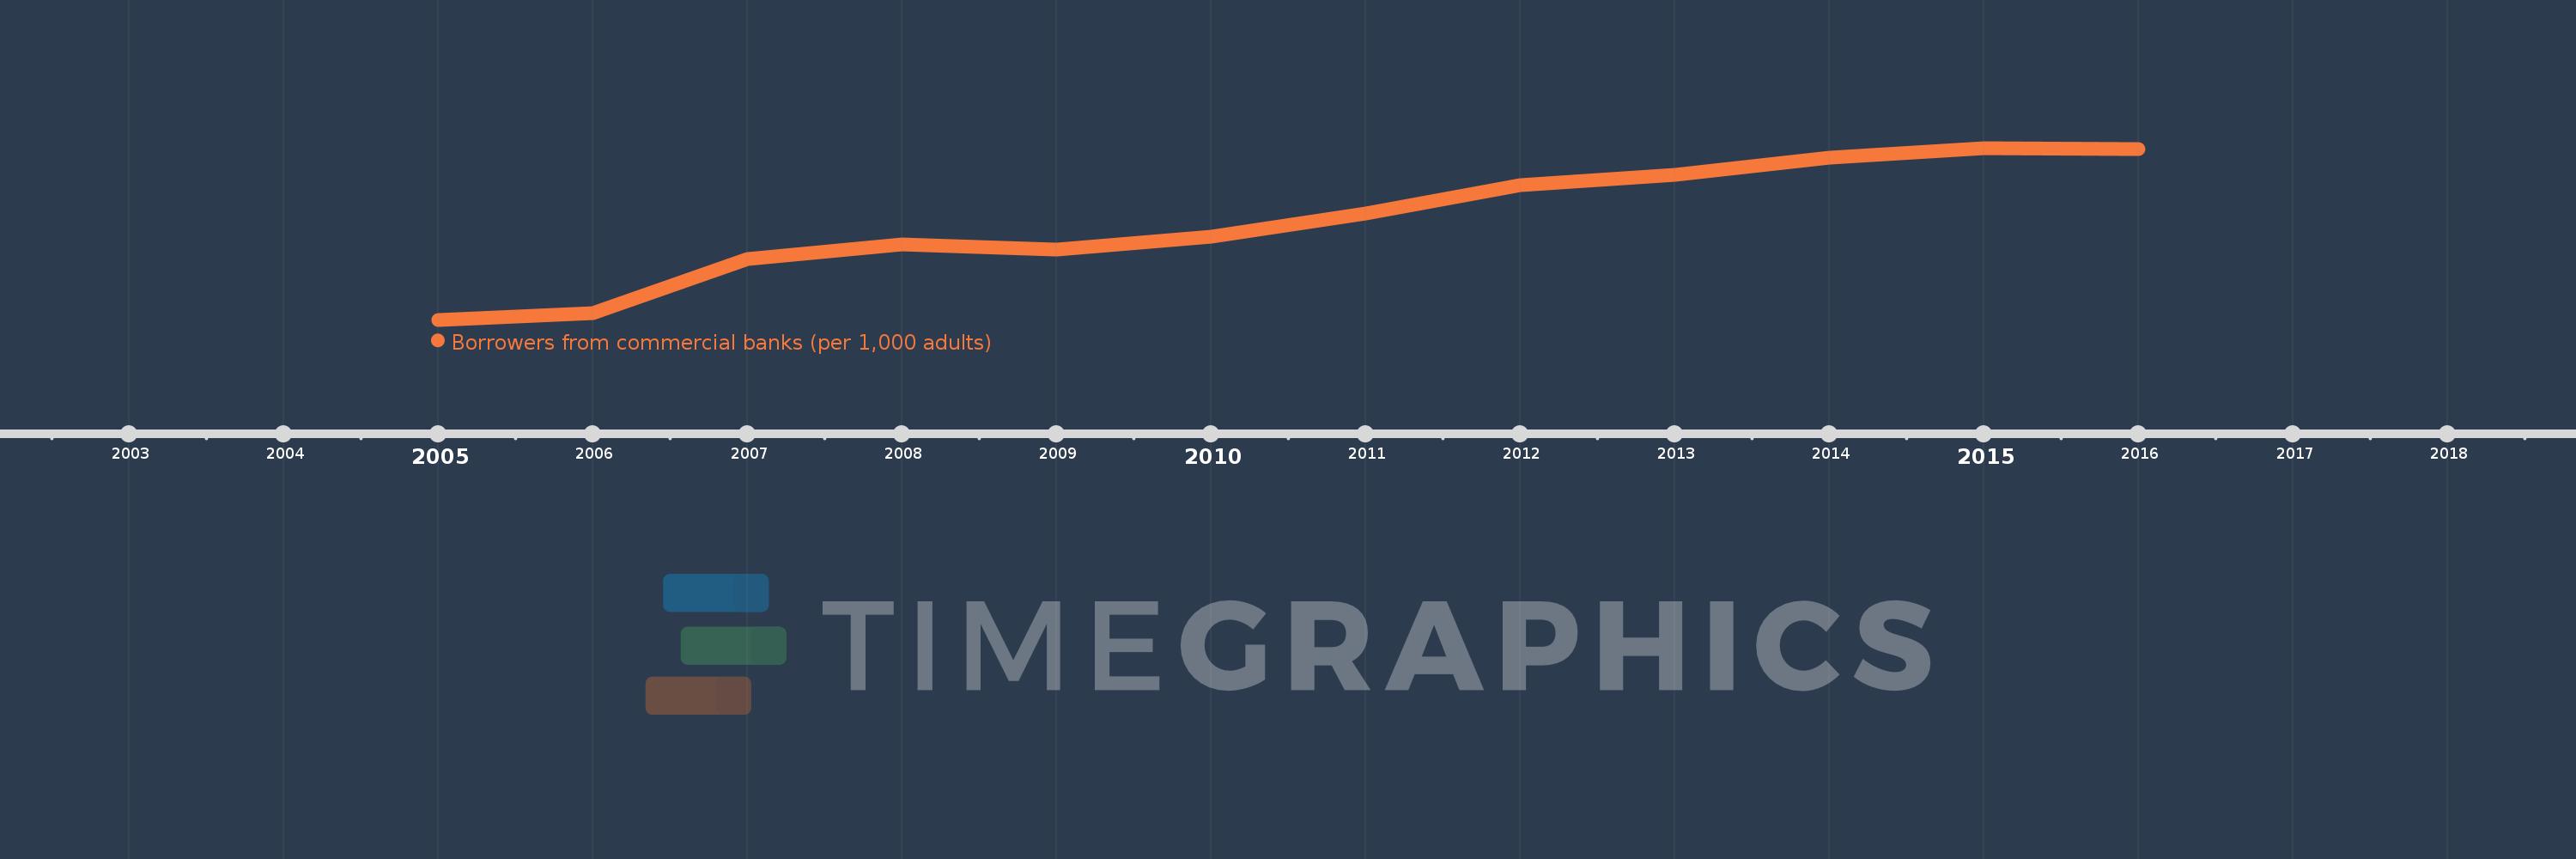
Borrowers from commercial banks (per 1,000 adults)
2016,2015,2014,2013,2012,2011,2010,2009,2008,2007,2006,2005
This statistics in other country:
Timeline:
This timeline shows a graph from 2005 to 2016 of Singapore. No data until 2004. Number of actual observations by date: 12.
Source name:
World Development Indicators
Source organization:
International Monetary Fund, Financial Access Survey.
Categories, topics:
Financial Sector
Last updated:
apr 23, 2017
Indicators value changes by year
Minimum:
647.867
jan 1, 2005
Maximum:
1.156K
jan 1, 2015
At the date of observation
Value
Absolute change
Change from previous value
jan 1, 2005
647.867
+647.867
0.0%
jan 1, 2006
667.84
+19.974
3.08%
jan 1, 2007
828.295
+160.455
24.03%
jan 1, 2008
871.615
+43.32
5.23%
jan 1, 2009
854.503
-17.112
-1.96%
jan 1, 2010
894.516
+40.013
4.68%
jan 1, 2011
962.79
+68.274
7.63%
jan 1, 2012
1.046K
+82.927
8.61%
jan 1, 2013
1.078K
+31.867
3.05%
jan 1, 2014
1.127K
+49.702
4.61%
jan 1, 2015
1.156K
+28.761
2.55%
jan 1, 2016
1.152K
-4.191
-0.36%
Ranking of countries by current statistics by years


Comments: