29
/
en
AIzaSyAYiBZKx7MnpbEhh9jyipgxe19OcubqV5w
April 1, 2024
175075
Latvia
LVA
true
2
1
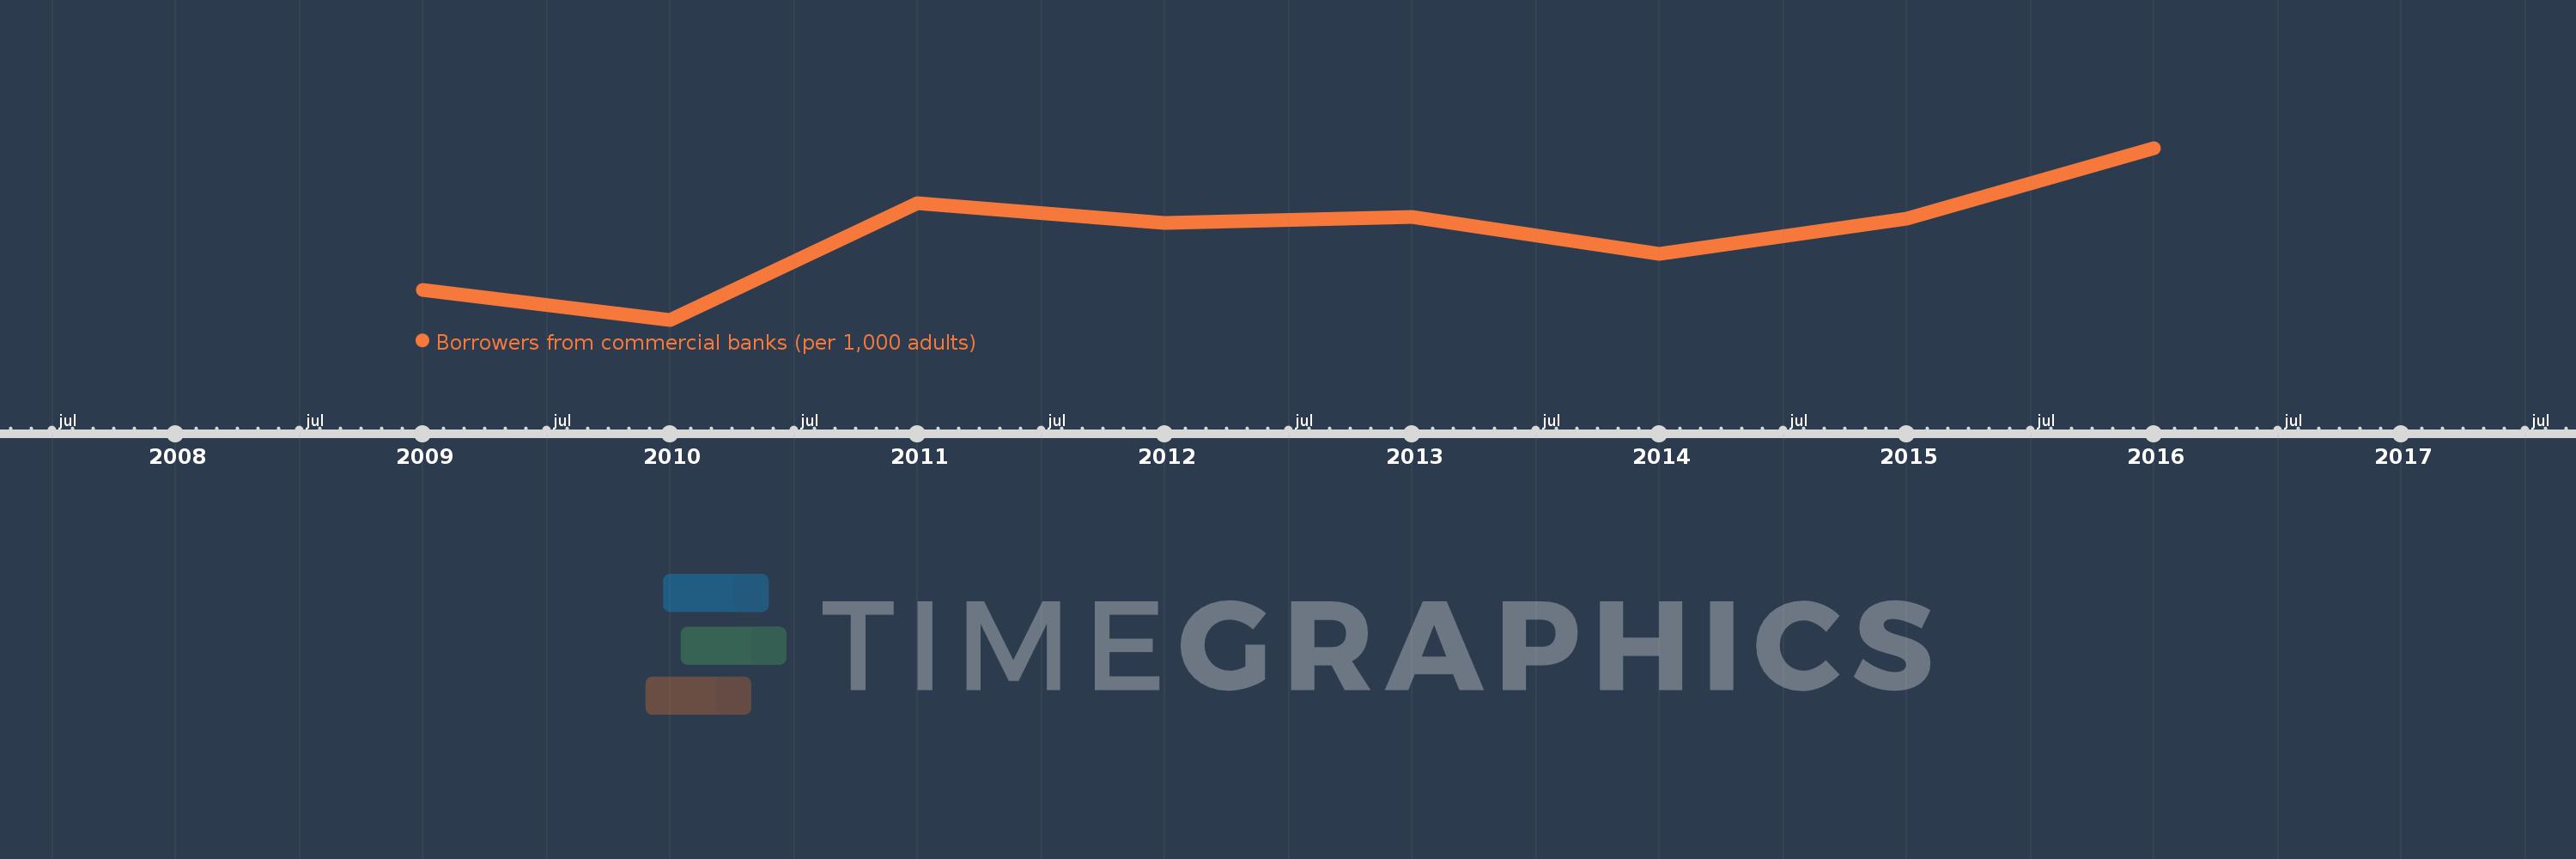
Borrowers from commercial banks (per 1,000 adults)
2016,2015,2014,2013,2012,2011,2010,2009
This statistics in other country:
Timeline:
This timeline shows a graph from 2009 to 2016 of Latvia. No data until 2008. Number of actual observations by date: 8.
Source name:
World Development Indicators
Source organization:
International Monetary Fund, Financial Access Survey.
Categories, topics:
Financial Sector
Last updated:
apr 23, 2017
Indicators value changes by year
Minimum:
326.123
jan 1, 2010
Maximum:
367.613
jan 1, 2016
At the date of observation
Value
Absolute change
Change from previous value
jan 1, 2009
333.334
+333.334
0.0%
jan 1, 2010
326.123
-7.211
-2.16%
jan 1, 2011
354.362
+28.239
8.66%
jan 1, 2012
349.486
-4.876
-1.38%
jan 1, 2013
350.868
+1.382
0.4%
jan 1, 2014
342.099
-8.769
-2.5%
jan 1, 2015
350.511
+8.412
2.46%
jan 1, 2016
367.613
+17.102
4.88%
Ranking of countries by current statistics by years


Comments: