29
/
en
AIzaSyAYiBZKx7MnpbEhh9jyipgxe19OcubqV5w
April 1, 2024
259266
Tajikistan
TJK
true
2
1
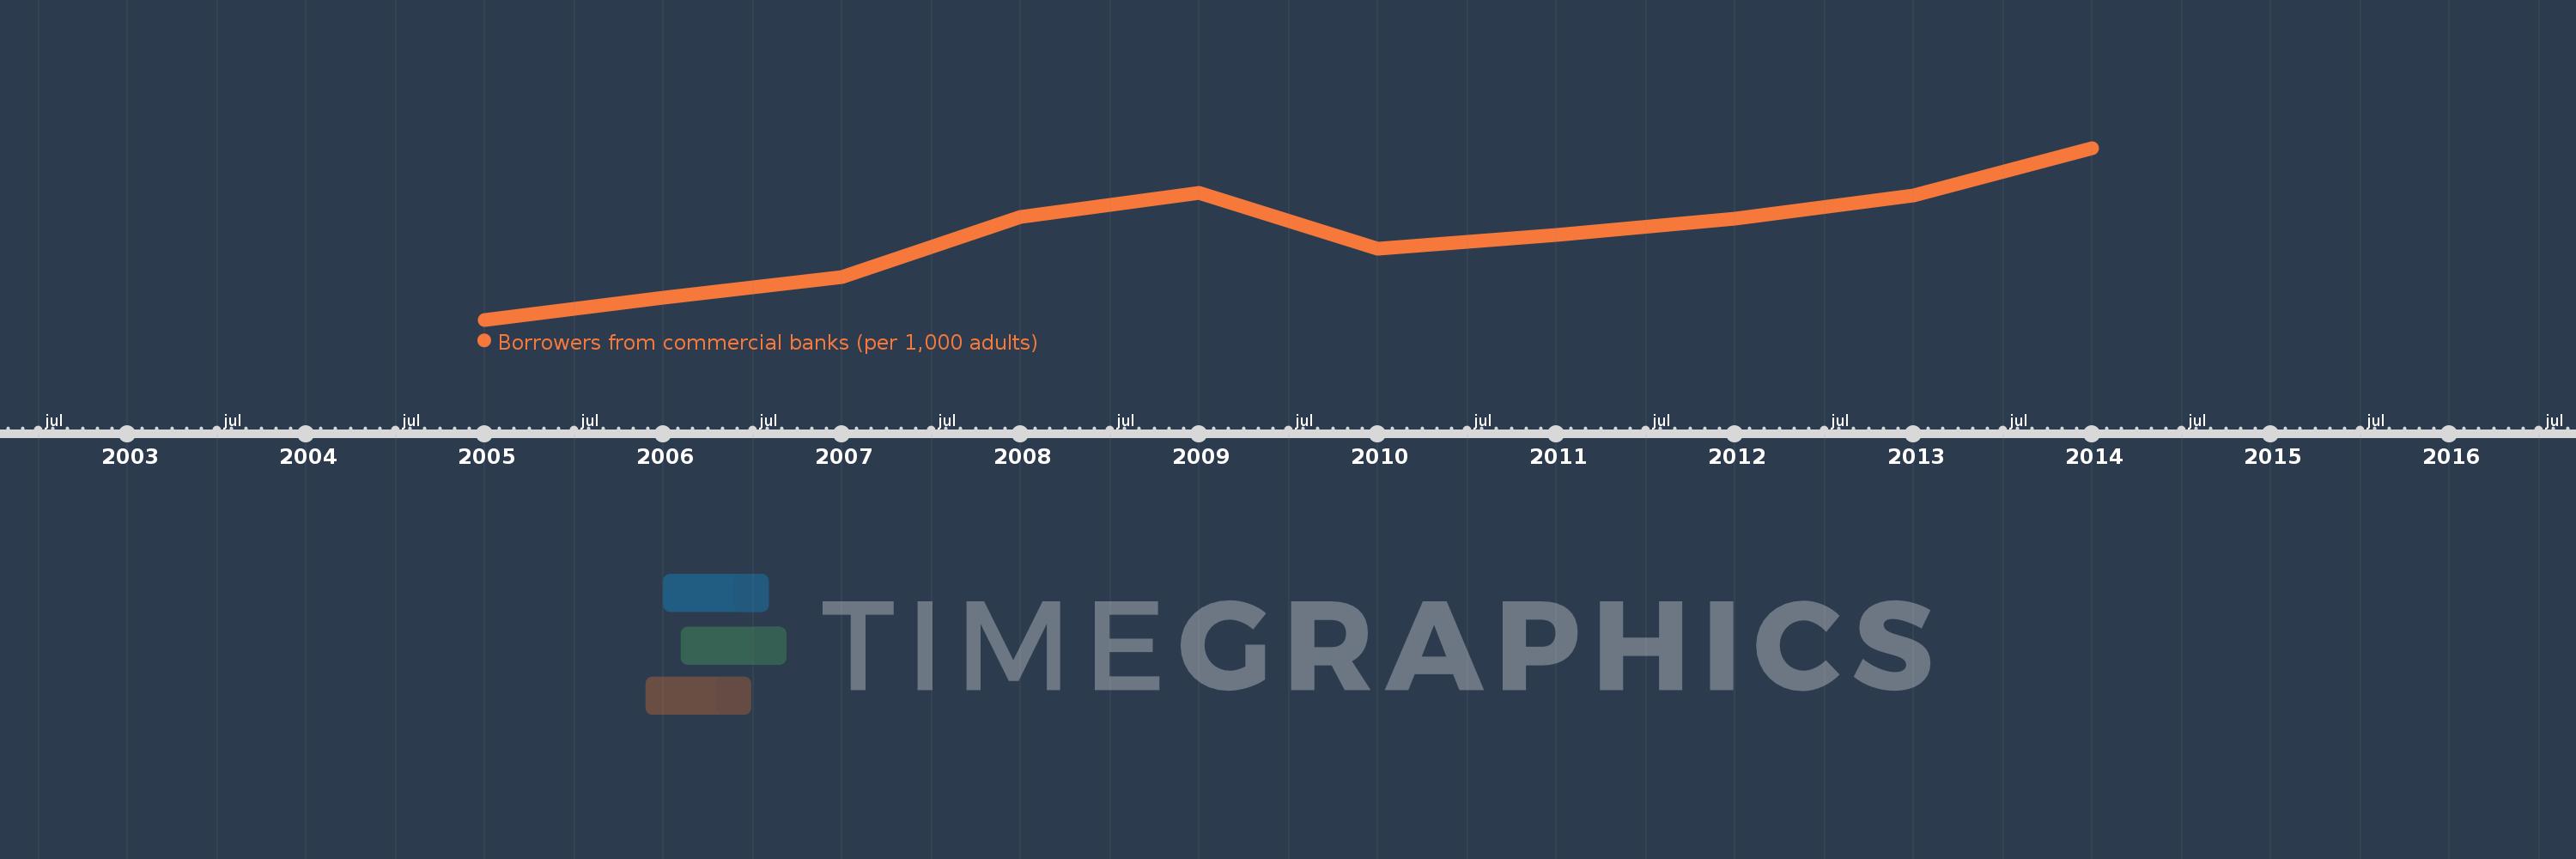
Borrowers from commercial banks (per 1,000 adults)
2014,2013,2012,2011,2010,2009,2008,2007,2006,2005
This statistics in other country:
Timeline:
This timeline shows a graph from 2005 to 2014 of Tajikistan. No data until 2004. Number of actual observations by date: 10.
Source name:
World Development Indicators
Source organization:
International Monetary Fund, Financial Access Survey.
Categories, topics:
Financial Sector
Last updated:
apr 23, 2017
Indicators value changes by year
Maximum:
34.396
jan 1, 2014
At the date of observation
Value
Absolute change
Change from previous value
jan 1, 2005
3.311
+3.311
0.0%
jan 1, 2006
7.311
+4.001
120.84%
jan 1, 2007
10.973
+3.661
50.08%
jan 1, 2008
21.964
+10.992
100.17%
jan 1, 2009
26.306
+4.341
19.76%
jan 1, 2010
16.104
-10.201
-38.78%
jan 1, 2011
18.58
+2.476
15.37%
jan 1, 2012
21.554
+2.974
16.01%
jan 1, 2013
25.801
+4.247
19.7%
jan 1, 2014
34.396
+8.595
33.31%
Ranking of countries by current statistics by years


Comments: