29
/
en
AIzaSyAYiBZKx7MnpbEhh9jyipgxe19OcubqV5w
April 1, 2024
37971
IDA blend
IDB
false
2
1
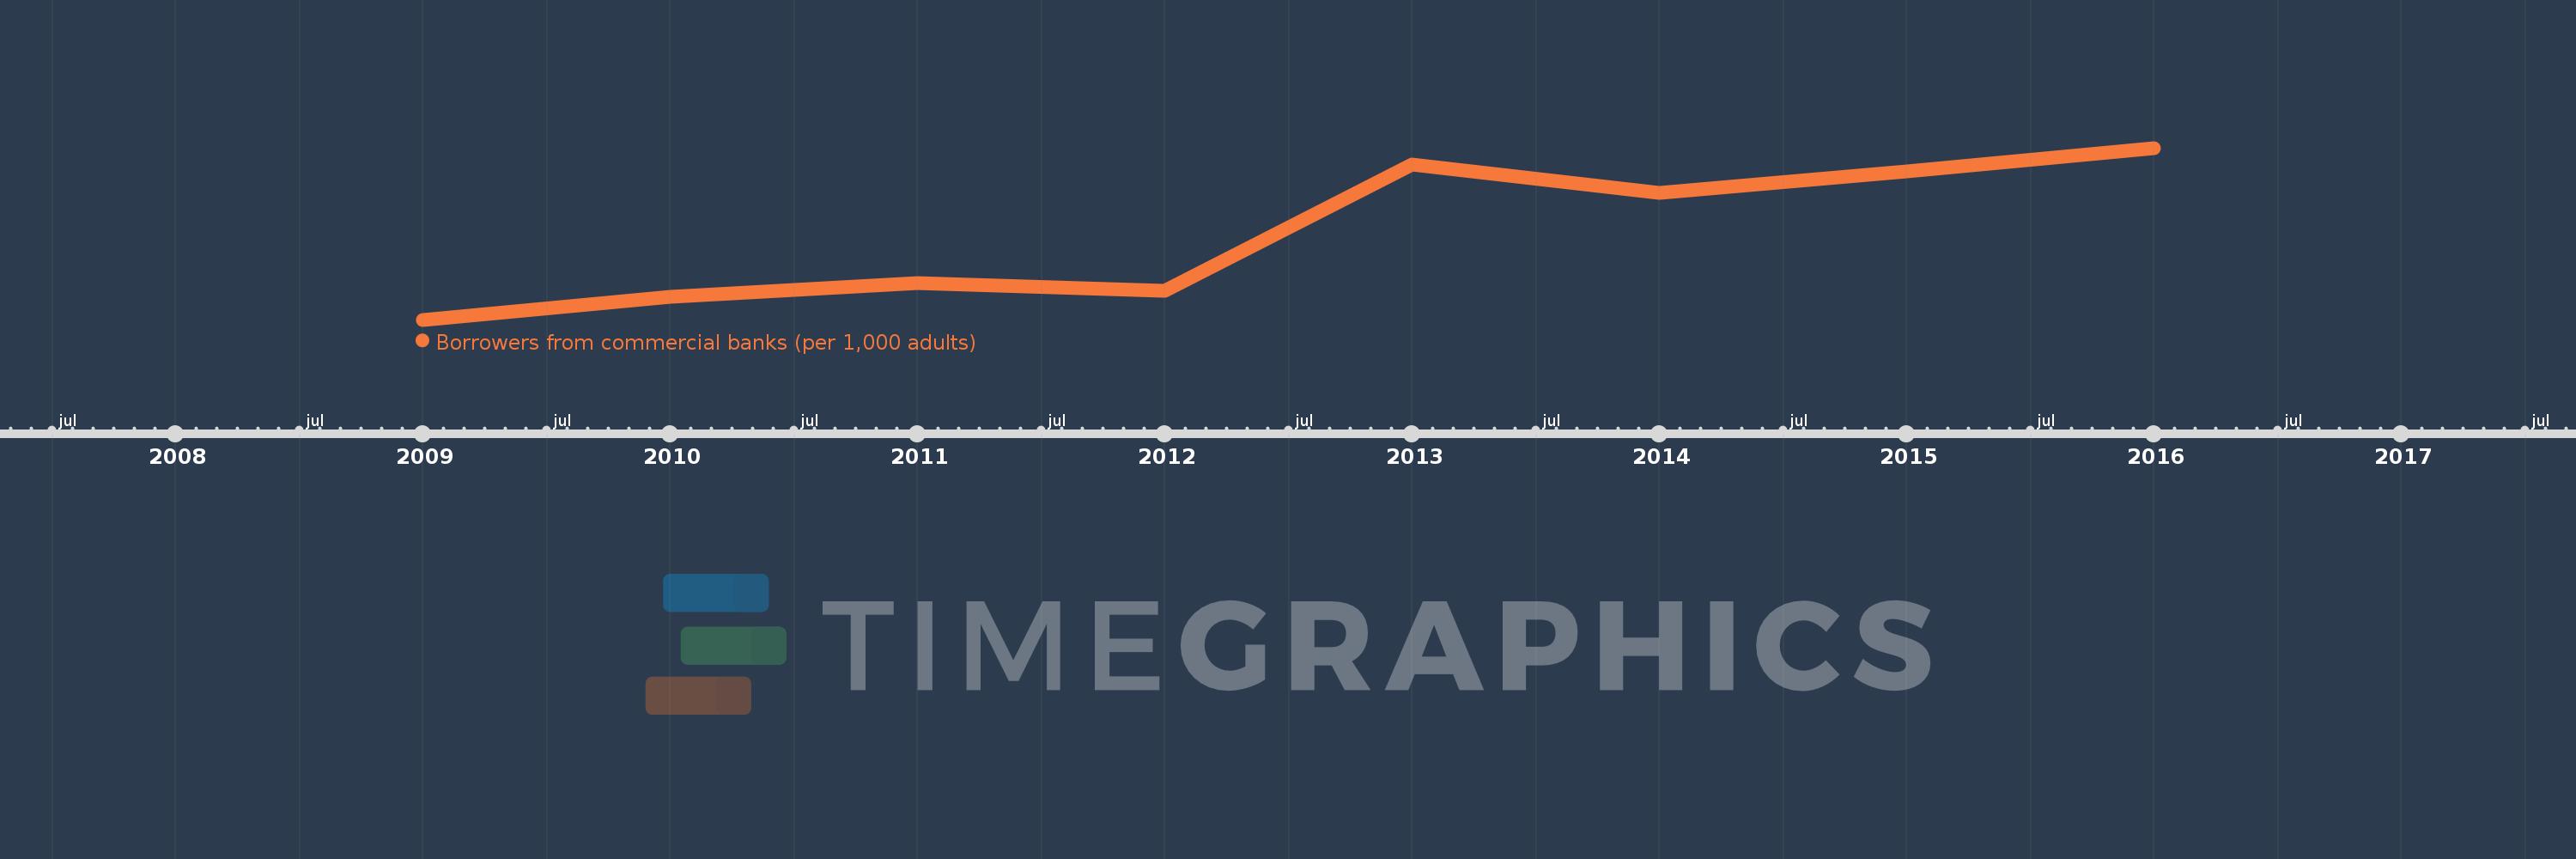
Borrowers from commercial banks (per 1,000 adults)
2016,2015,2014,2013,2012,2011,2010,2009
This statistics in other country:
Timeline:
This timeline shows a graph from 2009 to 2016 of IDA blend. No data until 2008. Number of actual observations by date: 8.
Source name:
World Development Indicators
Source organization:
International Monetary Fund, Financial Access Survey.
Categories, topics:
Financial Sector
Last updated:
apr 23, 2017
Indicators value changes by year
Maximum:
39.418
jan 1, 2016
At the date of observation
Value
Absolute change
Change from previous value
jan 1, 2009
26.15
+26.15
0.0%
jan 1, 2010
27.891
+1.741
6.66%
jan 1, 2011
28.96
+1.07
3.83%
jan 1, 2012
28.41
-0.551
-1.9%
jan 1, 2013
38.114
+9.704
34.16%
jan 1, 2014
35.965
-2.148
-5.64%
jan 1, 2015
37.618
+1.652
4.59%
jan 1, 2016
39.418
+1.801
4.79%
Ranking of countries by current statistics by years


Comments: