29
/
en
AIzaSyAYiBZKx7MnpbEhh9jyipgxe19OcubqV5w
April 1, 2024
228163
Romania
ROU
true
2
1
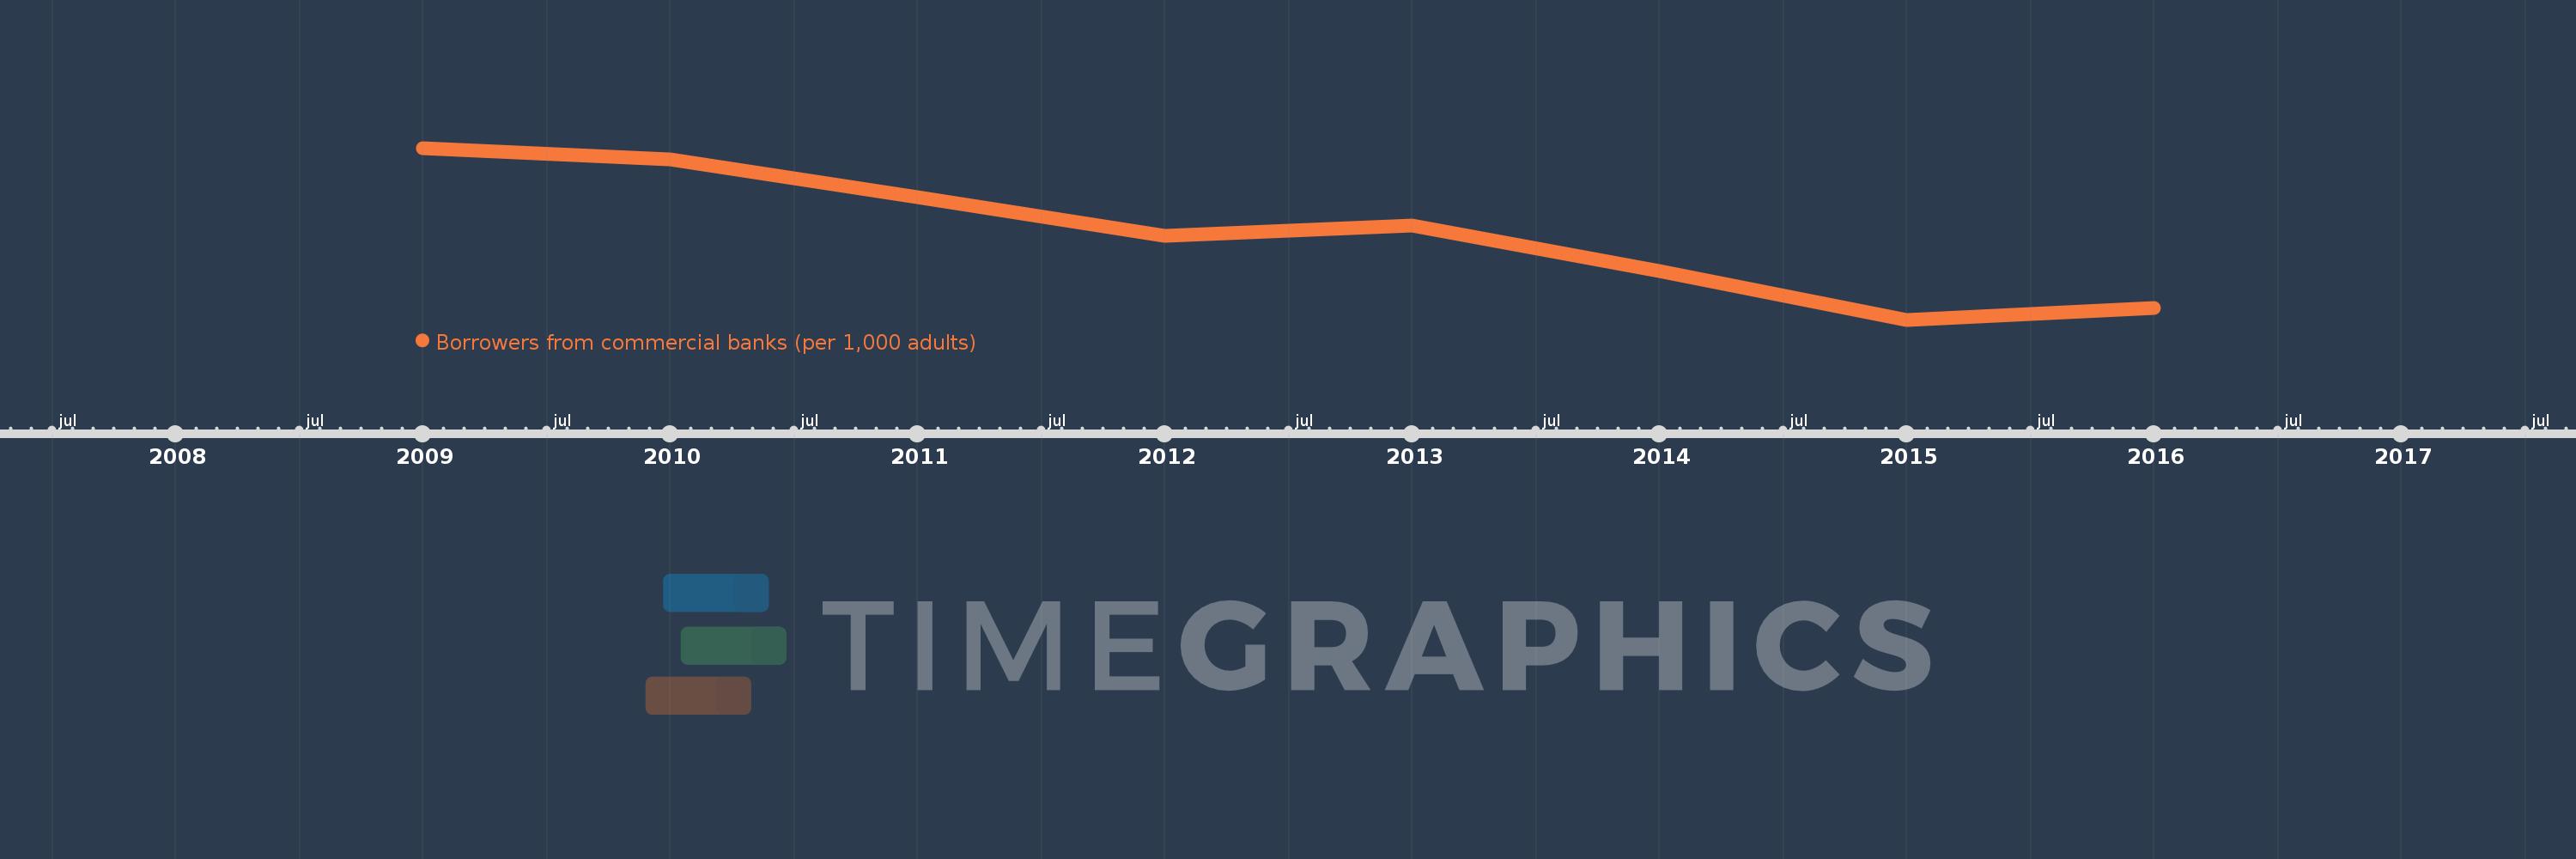
Borrowers from commercial banks (per 1,000 adults)
2016,2015,2014,2013,2012,2011,2010,2009
This statistics in other country:
Timeline:
This timeline shows a graph from 2009 to 2016 of Romania. No data until 2008. Number of actual observations by date: 8.
Source name:
World Development Indicators
Source organization:
International Monetary Fund, Financial Access Survey.
Categories, topics:
Financial Sector
Last updated:
apr 23, 2017
Indicators value changes by year
Minimum:
213.249
jan 1, 2015
Maximum:
244.583
jan 1, 2009
At the date of observation
Value
Absolute change
Change from previous value
jan 1, 2009
244.583
+244.583
0.0%
jan 1, 2010
242.45
-2.133
-0.87%
jan 1, 2011
235.576
-6.875
-2.84%
jan 1, 2012
228.567
-7.009
-2.98%
jan 1, 2013
230.503
+1.936
0.85%
jan 1, 2014
222.126
-8.377
-3.63%
jan 1, 2015
213.249
-8.877
-4.0%
jan 1, 2016
215.38
+2.131
1.0%
Ranking of countries by current statistics by years


Comments: