29
/
en
AIzaSyAYiBZKx7MnpbEhh9jyipgxe19OcubqV5w
April 1, 2024
98162
Cambodia
KHM
true
2
1
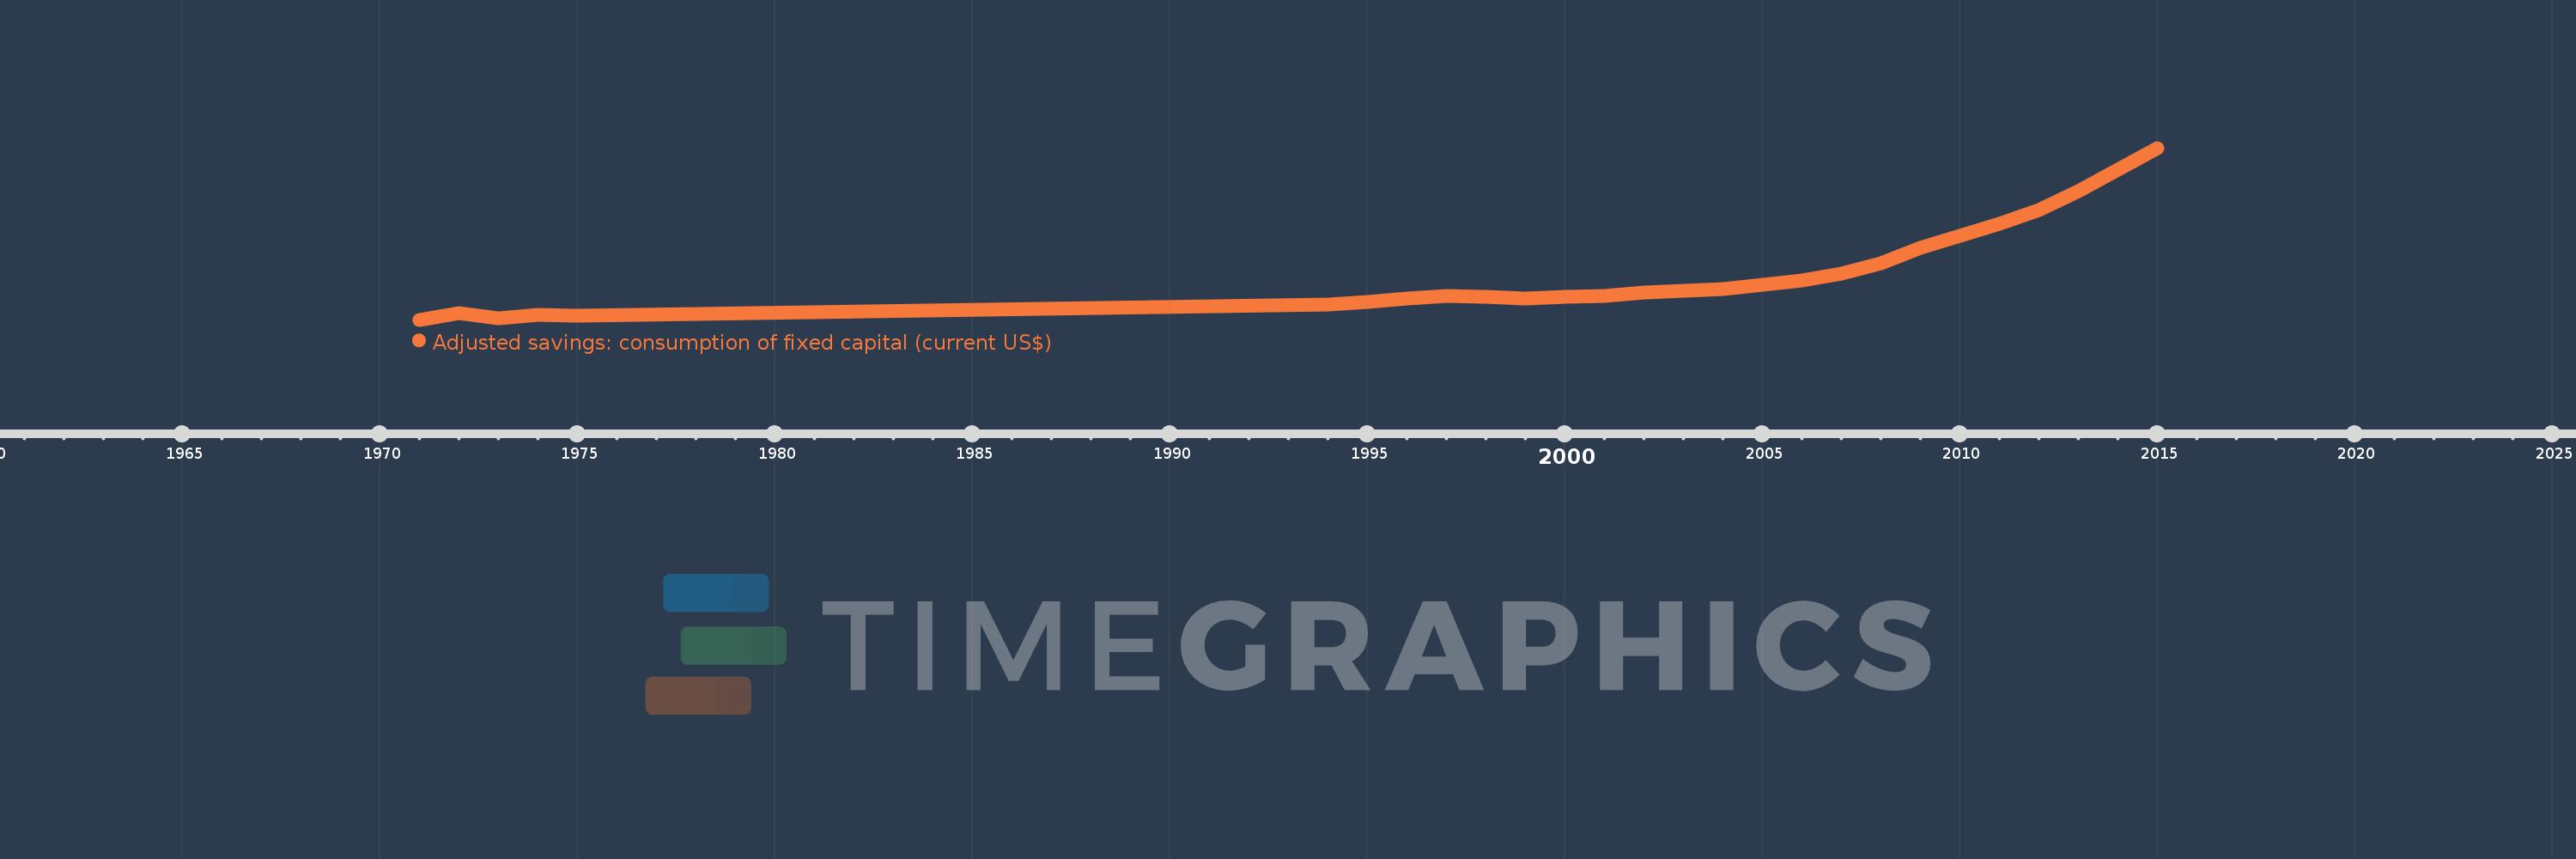
Adjusted savings: consumption of fixed capital (current US$)
2015,2014,2013,2012,2011,2010,2009,2008,2007,2006,2005,2004,2003,2002,2001,2000,1999,1998,1997,1996,1995,1994,1975,1974,1973,1972,1971
This statistics in other country:
AfghanistanAlbaniaAlgeriaAndorraAngolaAntigua and BarbudaArgentinaArmeniaArubaAustraliaAustriaAzerbaijanBahamas, TheBahrainBangladeshBarbadosBelarusBelgiumBelizeBeninBermudaBhutanBoliviaBosnia and HerzegovinaBotswanaBrazilBrunei DarussalamBulgariaBurkina FasoBurundiCabo VerdeCambodiaCameroonCanadaCayman IslandsCentral African RepublicChadChannel IslandsChileChinaColombiaComorosCongo, Dem. Rep.Congo, Rep.Costa RicaCote d'IvoireCroatiaCubaCyprusCzech RepublicDenmarkDjiboutiDominicaDominican RepublicEcuadorEgypt, Arab Rep.El SalvadorEquatorial GuineaEritreaEstoniaEthiopiaFaroe IslandsFijiFinlandFranceFrench PolynesiaGabonGambia, TheGeorgiaGermanyGhanaGreeceGreenlandGrenadaGuatemalaGuineaGuinea-BissauGuyanaHaitiHondurasHong Kong SAR, ChinaHungaryIcelandIndiaIndonesiaIran, Islamic Rep.IraqIrelandIsle of ManIsraelItalyJamaicaJapanJordanKazakhstanKenyaKiribatiKorea, Rep.KosovoKuwaitKyrgyz RepublicLao PDRLatviaLebanonLesothoLiberiaLibyaLiechtensteinLithuaniaLuxembourgMacao SAR, ChinaMacedonia, FYRMadagascarMalawiMalaysiaMaldivesMaliMaltaMarshall IslandsMauritaniaMauritiusMexicoMicronesia, Fed. Sts.MoldovaMonacoMongoliaMontenegroMoroccoMozambiqueMyanmarNamibiaNepalNetherlandsNew CaledoniaNew ZealandNicaraguaNigerNigeriaNorwayOmanPakistanPalauPanamaPapua New GuineaParaguayPeruPhilippinesPolandPortugalPuerto RicoQatarRomaniaRussian FederationRwandaSamoaSan MarinoSao Tome and PrincipeSaudi ArabiaSenegalSerbiaSeychellesSierra LeoneSingaporeSlovak RepublicSloveniaSolomon IslandsSomaliaSouth AfricaSouth SudanSpainSri LankaSt. Kitts and NevisSt. LuciaSt. Vincent and the GrenadinesSudanSurinameSwazilandSwedenSwitzerlandSyrian Arab RepublicTajikistanTanzaniaThailandTimor-LesteTogoTongaTrinidad and TobagoTunisiaTurkeyTurkmenistanTuvaluUgandaUkraineUnited Arab EmiratesUnited KingdomUnited StatesUruguayUzbekistanVanuatuVenezuela, RBVietnamVirgin Islands (U.S.)West Bank and GazaYemen, Rep.ZambiaZimbabwe Timeline:
This timeline shows a graph from 1971 to 2015 of Cambodia. No data until 1970. Number of actual observations by date: 27.
Source name:
World Development Indicators
Source organization:
World Bank staff estimates using data from the United Nations Statistics Division's National Accounts Statistics.
Categories, topics:
Economy & Growth, Environment
Last updated:
apr 23, 2017
Indicators value changes by year
Minimum:
32.585 mln
jan 1, 1971
Maximum:
1.814 bln
jan 1, 2015
At the date of observation
Value
Absolute change
Change from previous value
jan 1, 1971
32.585 mln
+32.585 mln
0.0%
jan 1, 1972
96.849 mln
+64.264 mln
197.22%
jan 1, 1973
51.559 mln
-45.291 mln
-46.76%
jan 1, 1974
85.689 mln
+34.131 mln
66.2%
jan 1, 1975
72.748 mln
-12.941 mln
-15.1%
jan 1, 1994
191.545 mln
+118.797 mln
163.3%
jan 1, 1995
213.859 mln
+22.315 mln
11.65%
jan 1, 1996
255.96 mln
+42.1 mln
19.69%
jan 1, 1997
275.09 mln
+19.13 mln
7.47%
jan 1, 1998
270.991 mln
-4.099 mln
-1.49%
jan 1, 1999
255.273 mln
-15.718 mln
-5.8%
jan 1, 2000
270.021 mln
+14.748 mln
5.78%
jan 1, 2001
278.737 mln
+8.716 mln
3.23%
jan 1, 2002
313.084 mln
+34.347 mln
12.32%
jan 1, 2003
329.788 mln
+16.703 mln
5.34%
jan 1, 2004
354.996 mln
+25.208 mln
7.64%
jan 1, 2005
395.451 mln
+40.455 mln
11.4%
jan 1, 2006
440.373 mln
+44.923 mln
11.36%
jan 1, 2007
509.591 mln
+69.218 mln
15.72%
jan 1, 2008
616.578 mln
+106.987 mln
20.99%
jan 1, 2009
774.026 mln
+157.448 mln
25.54%
jan 1, 2010
900.996 mln
+126.97 mln
16.4%
jan 1, 2011
1.024 bln
+123.108 mln
13.66%
jan 1, 2012
1.173 bln
+149.26 mln
14.57%
jan 1, 2013
1.362 bln
+188.643 mln
16.08%
jan 1, 2014
1.585 bln
+222.854 mln
16.36%
jan 1, 2015
1.814 bln
+229.571 mln
14.49%
Ranking of countries by current statistics by years


Comments: