29
/
en
AIzaSyAYiBZKx7MnpbEhh9jyipgxe19OcubqV5w
April 1, 2024
276337
United States
USA
true
2
1
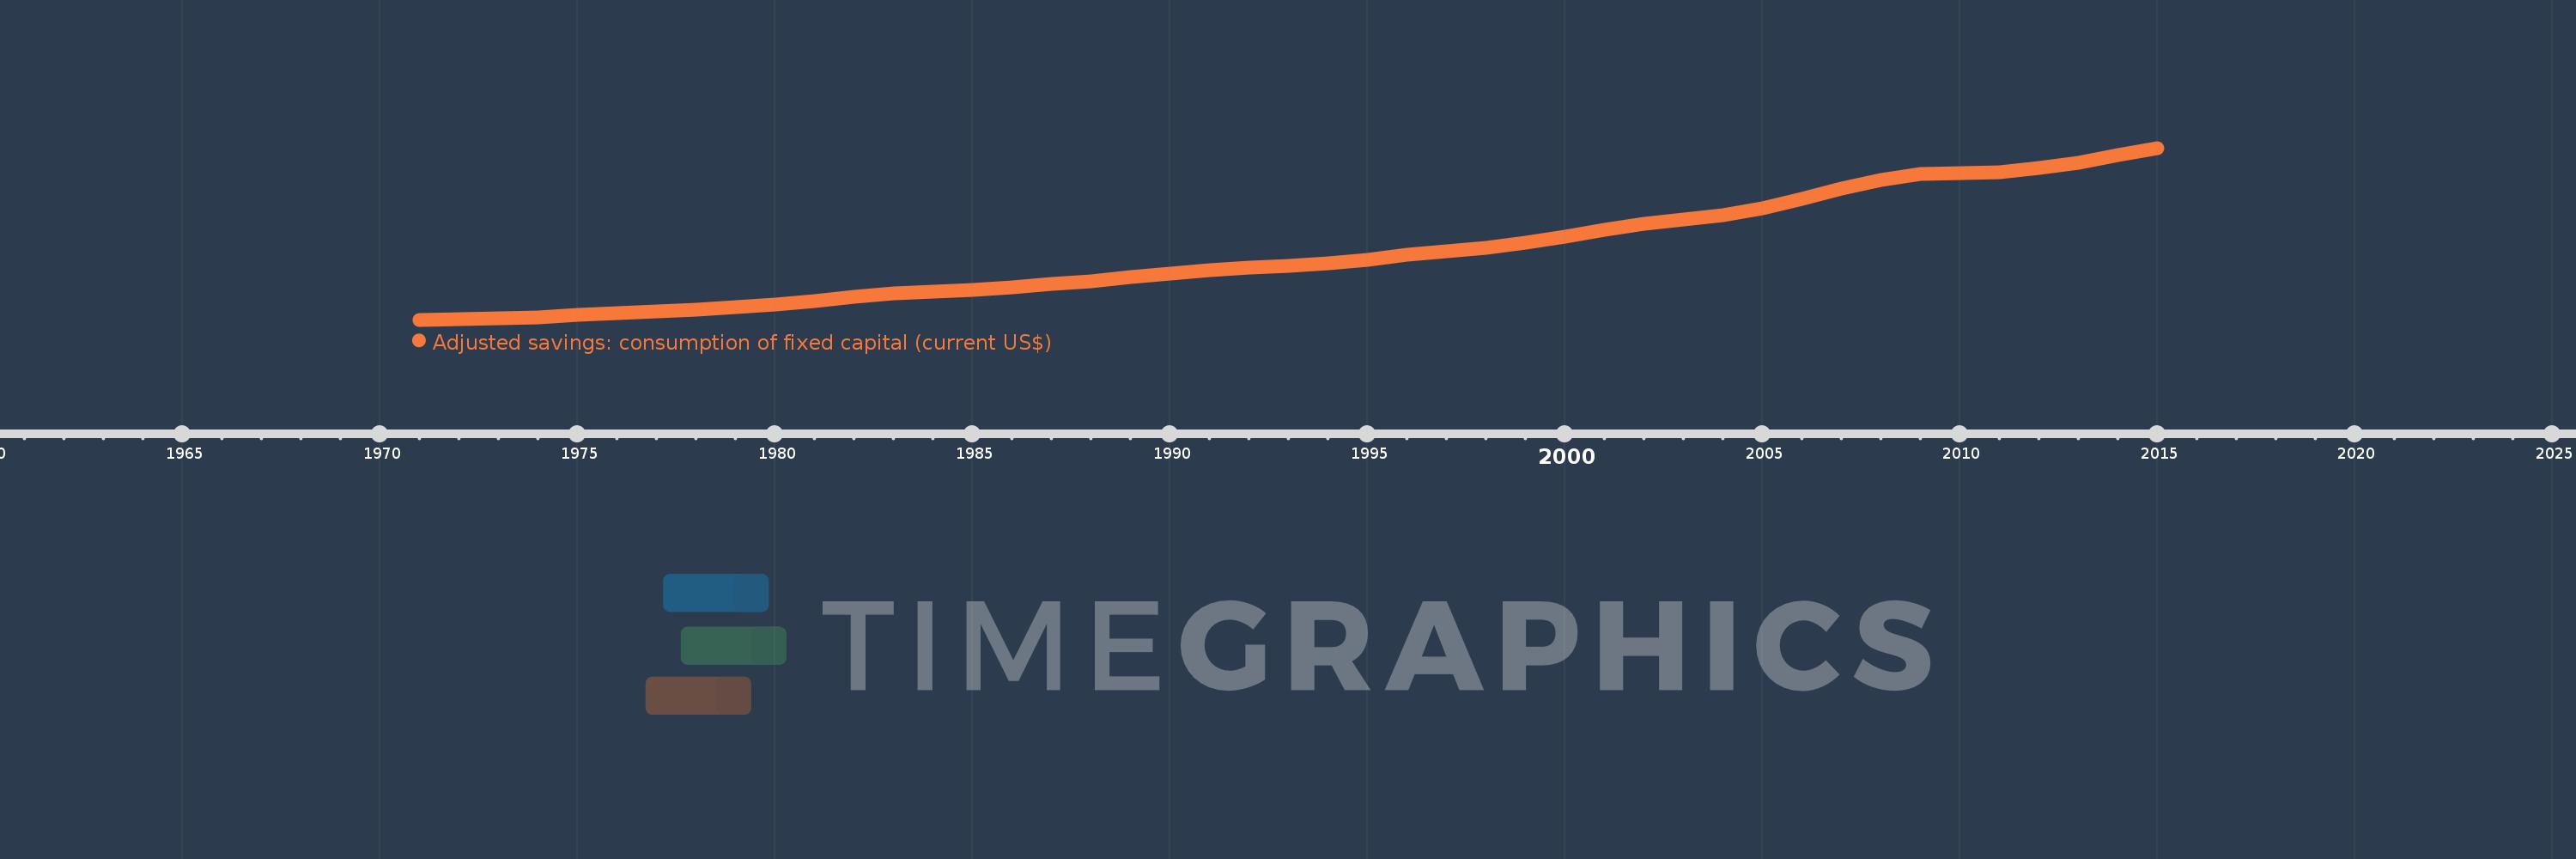
Adjusted savings: consumption of fixed capital (current US$)
2015,2014,2013,2012,2011,2010,2009,2008,2007,2006,2005,2004,2003,2002,2001,2000,1999,1998,1997,1996,1995,1994,1993,1992,1991,1990,1989,1988,1987,1986,1985,1984,1983,1982,1981,1980,1979,1978,1977,1976,1975,1974,1973,1972,1971
This statistics in other country:
AfghanistanAlbaniaAlgeriaAndorraAngolaAntigua and BarbudaArgentinaArmeniaArubaAustraliaAustriaAzerbaijanBahamas, TheBahrainBangladeshBarbadosBelarusBelgiumBelizeBeninBermudaBhutanBoliviaBosnia and HerzegovinaBotswanaBrazilBrunei DarussalamBulgariaBurkina FasoBurundiCabo VerdeCambodiaCameroonCanadaCayman IslandsCentral African RepublicChadChannel IslandsChileChinaColombiaComorosCongo, Dem. Rep.Congo, Rep.Costa RicaCote d'IvoireCroatiaCubaCyprusCzech RepublicDenmarkDjiboutiDominicaDominican RepublicEcuadorEgypt, Arab Rep.El SalvadorEquatorial GuineaEritreaEstoniaEthiopiaFaroe IslandsFijiFinlandFranceFrench PolynesiaGabonGambia, TheGeorgiaGermanyGhanaGreeceGreenlandGrenadaGuatemalaGuineaGuinea-BissauGuyanaHaitiHondurasHong Kong SAR, ChinaHungaryIcelandIndiaIndonesiaIran, Islamic Rep.IraqIrelandIsle of ManIsraelItalyJamaicaJapanJordanKazakhstanKenyaKiribatiKorea, Rep.KosovoKuwaitKyrgyz RepublicLao PDRLatviaLebanonLesothoLiberiaLibyaLiechtensteinLithuaniaLuxembourgMacao SAR, ChinaMacedonia, FYRMadagascarMalawiMalaysiaMaldivesMaliMaltaMarshall IslandsMauritaniaMauritiusMexicoMicronesia, Fed. Sts.MoldovaMonacoMongoliaMontenegroMoroccoMozambiqueMyanmarNamibiaNepalNetherlandsNew CaledoniaNew ZealandNicaraguaNigerNigeriaNorwayOmanPakistanPalauPanamaPapua New GuineaParaguayPeruPhilippinesPolandPortugalPuerto RicoQatarRomaniaRussian FederationRwandaSamoaSan MarinoSao Tome and PrincipeSaudi ArabiaSenegalSerbiaSeychellesSierra LeoneSingaporeSlovak RepublicSloveniaSolomon IslandsSomaliaSouth AfricaSouth SudanSpainSri LankaSt. Kitts and NevisSt. LuciaSt. Vincent and the GrenadinesSudanSurinameSwazilandSwedenSwitzerlandSyrian Arab RepublicTajikistanTanzaniaThailandTimor-LesteTogoTongaTrinidad and TobagoTunisiaTurkeyTurkmenistanTuvaluUgandaUkraineUnited Arab EmiratesUnited KingdomUnited StatesUruguayUzbekistanVanuatuVenezuela, RBVietnamVirgin Islands (U.S.)West Bank and GazaYemen, Rep.ZambiaZimbabwe Timeline:
This timeline shows a graph from 1971 to 2015 of United States. No data until 1970. Number of actual observations by date: 45.
Source name:
World Development Indicators
Source organization:
World Bank staff estimates using data from the United Nations Statistics Division's National Accounts Statistics.
Categories, topics:
Economy & Growth, Environment
Last updated:
apr 23, 2017
Indicators value changes by year
Minimum:
136.782 bln
jan 1, 1971
Maximum:
2.758 trl
jan 1, 2015
At the date of observation
Value
Absolute change
Change from previous value
jan 1, 1971
136.782 bln
+136.782 bln
0.0%
jan 1, 1972
148.865 bln
+12.083 bln
8.83%
jan 1, 1973
160.897 bln
+12.032 bln
8.08%
jan 1, 1974
178.08 bln
+17.183 bln
10.68%
jan 1, 1975
206.169 bln
+28.089 bln
15.77%
jan 1, 1976
237.537 bln
+31.368 bln
15.21%
jan 1, 1977
259.209 bln
+21.673 bln
9.12%
jan 1, 1978
288.334 bln
+29.124 bln
11.24%
jan 1, 1979
325.063 bln
+36.729 bln
12.74%
jan 1, 1980
371.133 bln
+46.07 bln
14.17%
jan 1, 1981
426.008 bln
+54.875 bln
14.79%
jan 1, 1982
485.047 bln
+59.039 bln
13.86%
jan 1, 1983
534.316 bln
+49.269 bln
10.16%
jan 1, 1984
560.546 bln
+26.231 bln
4.91%
jan 1, 1985
594.334 bln
+33.787 bln
6.03%
jan 1, 1986
636.652 bln
+42.319 bln
7.12%
jan 1, 1987
682.164 bln
+45.511 bln
7.15%
jan 1, 1988
727.952 bln
+45.789 bln
6.71%
jan 1, 1989
782.387 bln
+54.435 bln
7.48%
jan 1, 1990
836.11 bln
+53.722 bln
6.87%
jan 1, 1991
886.829 bln
+50.72 bln
6.07%
jan 1, 1992
931.125 bln
+44.295 bln
4.99%
jan 1, 1993
959.725 bln
+28.601 bln
3.07%
jan 1, 1994
1.004 trl
+43.873 bln
4.57%
jan 1, 1995
1.056 trl
+51.974 bln
5.18%
jan 1, 1996
1.123 trl
+67.21 bln
6.37%
jan 1, 1997
1.176 trl
+53.237 bln
4.74%
jan 1, 1998
1.24 trl
+63.936 bln
5.44%
jan 1, 1999
1.31 trl
+70.316 bln
5.67%
jan 1, 2000
1.401 trl
+90.589 bln
6.91%
jan 1, 2001
1.514 trl
+113.383 bln
8.09%
jan 1, 2002
1.604 trl
+89.732 bln
5.93%
jan 1, 2003
1.662 trl
+58.091 bln
3.62%
jan 1, 2004
1.727 trl
+65.159 bln
3.92%
jan 1, 2005
1.832 trl
+104.47 bln
6.05%
jan 1, 2006
1.982 trl
+150.257 bln
8.2%
jan 1, 2007
2.136 trl
+154.069 bln
7.77%
jan 1, 2008
2.264 trl
+128.324 bln
6.01%
jan 1, 2009
2.363 trl
+99.031 bln
4.37%
jan 1, 2010
2.368 trl
+5.0 bln
0.21%
jan 1, 2011
2.382 trl
+13.22 bln
0.56%
jan 1, 2012
2.451 trl
+69.043 bln
2.9%
jan 1, 2013
2.535 trl
+84.815 bln
3.46%
jan 1, 2014
2.649 trl
+113.959 bln
4.49%
jan 1, 2015
2.758 trl
+108.527 bln
4.1%
Ranking of countries by current statistics by years


Comments: