29
/
en
AIzaSyAYiBZKx7MnpbEhh9jyipgxe19OcubqV5w
April 1, 2024
153250
Iceland
ISL
true
2
1
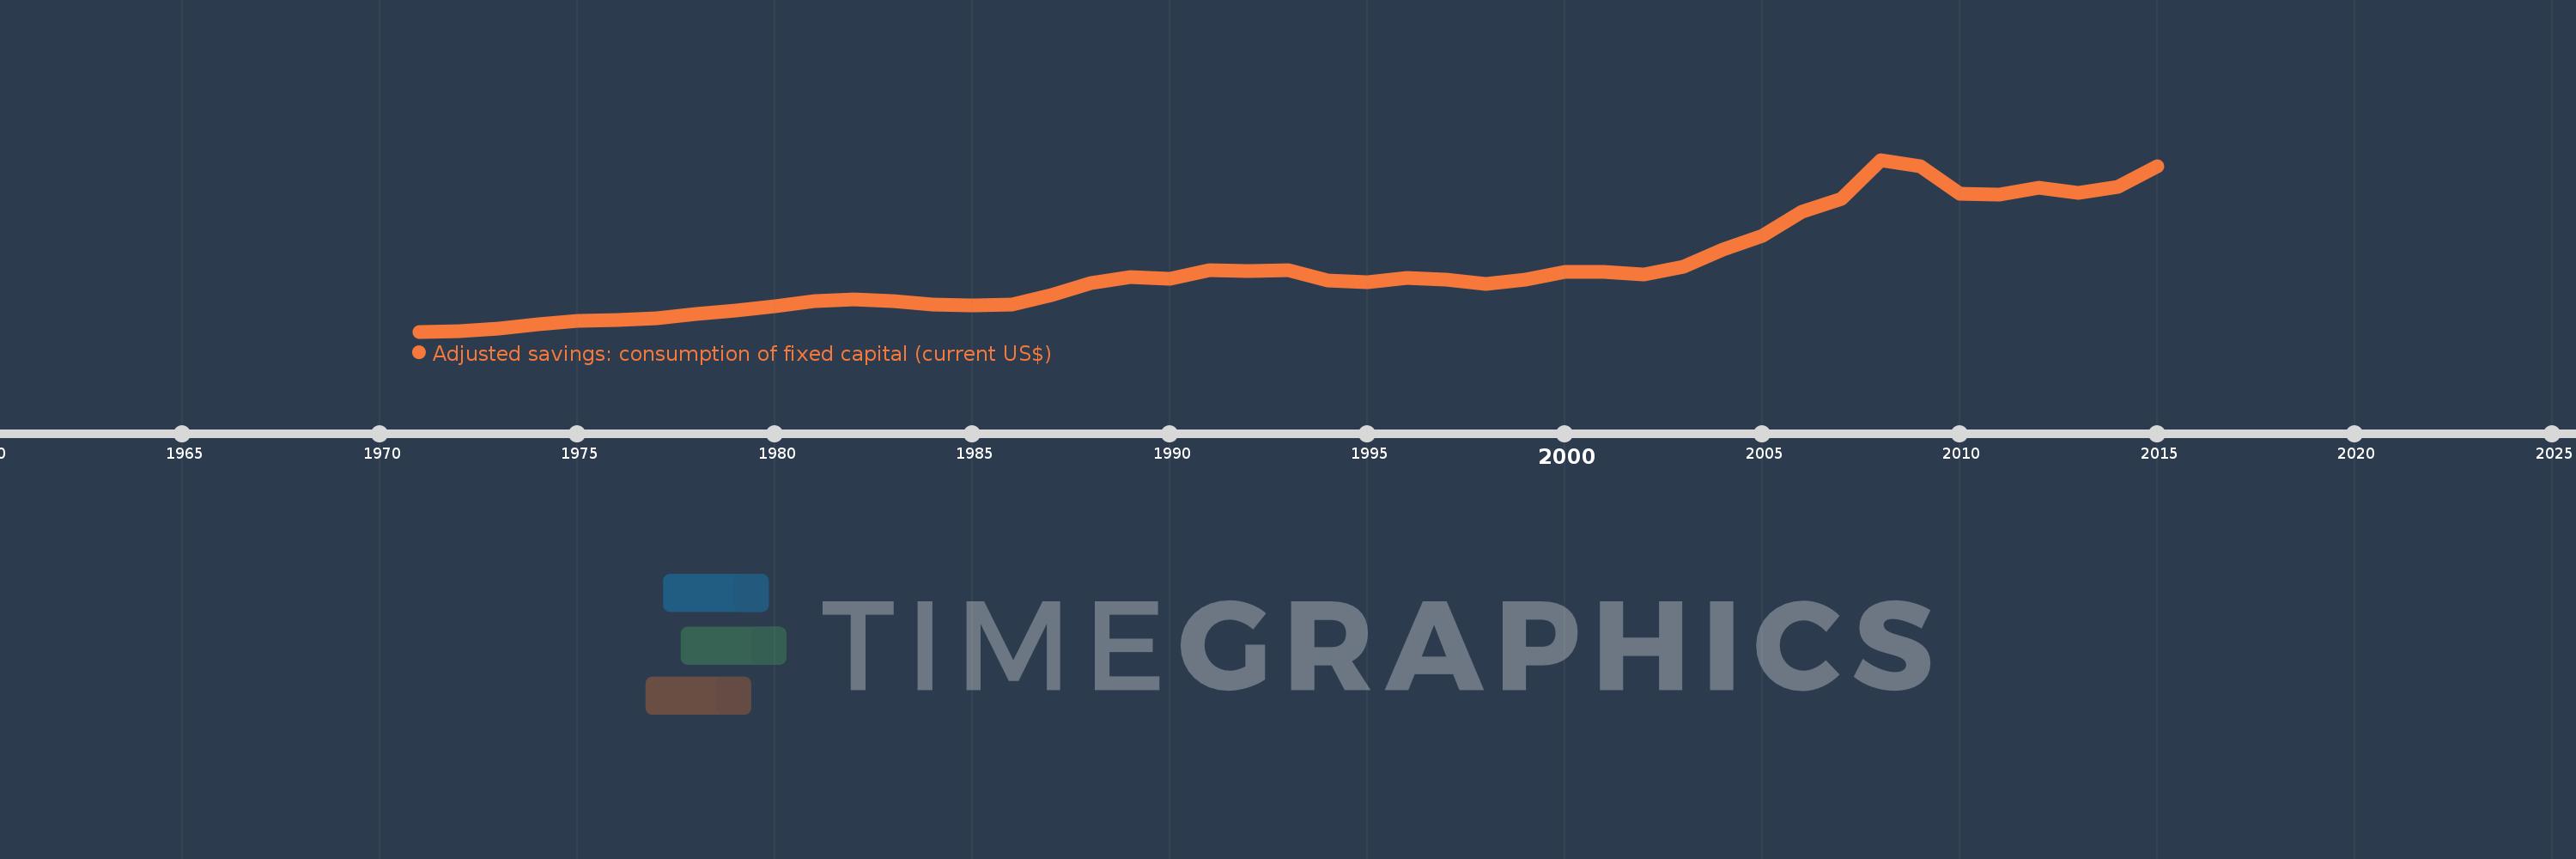
Adjusted savings: consumption of fixed capital (current US$)
2015,2014,2013,2012,2011,2010,2009,2008,2007,2006,2005,2004,2003,2002,2001,2000,1999,1998,1997,1996,1995,1994,1993,1992,1991,1990,1989,1988,1987,1986,1985,1984,1983,1982,1981,1980,1979,1978,1977,1976,1975,1974,1973,1972,1971
This statistics in other country:
AfghanistanAlbaniaAlgeriaAndorraAngolaAntigua and BarbudaArgentinaArmeniaArubaAustraliaAustriaAzerbaijanBahamas, TheBahrainBangladeshBarbadosBelarusBelgiumBelizeBeninBermudaBhutanBoliviaBosnia and HerzegovinaBotswanaBrazilBrunei DarussalamBulgariaBurkina FasoBurundiCabo VerdeCambodiaCameroonCanadaCayman IslandsCentral African RepublicChadChannel IslandsChileChinaColombiaComorosCongo, Dem. Rep.Congo, Rep.Costa RicaCote d'IvoireCroatiaCubaCyprusCzech RepublicDenmarkDjiboutiDominicaDominican RepublicEcuadorEgypt, Arab Rep.El SalvadorEquatorial GuineaEritreaEstoniaEthiopiaFaroe IslandsFijiFinlandFranceFrench PolynesiaGabonGambia, TheGeorgiaGermanyGhanaGreeceGreenlandGrenadaGuatemalaGuineaGuinea-BissauGuyanaHaitiHondurasHong Kong SAR, ChinaHungaryIcelandIndiaIndonesiaIran, Islamic Rep.IraqIrelandIsle of ManIsraelItalyJamaicaJapanJordanKazakhstanKenyaKiribatiKorea, Rep.KosovoKuwaitKyrgyz RepublicLao PDRLatviaLebanonLesothoLiberiaLibyaLiechtensteinLithuaniaLuxembourgMacao SAR, ChinaMacedonia, FYRMadagascarMalawiMalaysiaMaldivesMaliMaltaMarshall IslandsMauritaniaMauritiusMexicoMicronesia, Fed. Sts.MoldovaMonacoMongoliaMontenegroMoroccoMozambiqueMyanmarNamibiaNepalNetherlandsNew CaledoniaNew ZealandNicaraguaNigerNigeriaNorwayOmanPakistanPalauPanamaPapua New GuineaParaguayPeruPhilippinesPolandPortugalPuerto RicoQatarRomaniaRussian FederationRwandaSamoaSan MarinoSao Tome and PrincipeSaudi ArabiaSenegalSerbiaSeychellesSierra LeoneSingaporeSlovak RepublicSloveniaSolomon IslandsSomaliaSouth AfricaSouth SudanSpainSri LankaSt. Kitts and NevisSt. LuciaSt. Vincent and the GrenadinesSudanSurinameSwazilandSwedenSwitzerlandSyrian Arab RepublicTajikistanTanzaniaThailandTimor-LesteTogoTongaTrinidad and TobagoTunisiaTurkeyTurkmenistanTuvaluUgandaUkraineUnited Arab EmiratesUnited KingdomUnited StatesUruguayUzbekistanVanuatuVenezuela, RBVietnamVirgin Islands (U.S.)West Bank and GazaYemen, Rep.ZambiaZimbabwe Timeline:
This timeline shows a graph from 1971 to 2015 of Iceland. No data until 1970. Number of actual observations by date: 45.
Source name:
World Development Indicators
Source organization:
World Bank staff estimates using data from the United Nations Statistics Division's National Accounts Statistics.
Categories, topics:
Economy & Growth, Environment
Last updated:
apr 23, 2017
Indicators value changes by year
Minimum:
111.537 mln
jan 1, 1971
Maximum:
2.968 bln
jan 1, 2008
At the date of observation
Value
Absolute change
Change from previous value
jan 1, 1971
111.537 mln
+111.537 mln
0.0%
jan 1, 1972
124.952 mln
+13.415 mln
12.03%
jan 1, 1973
159.541 mln
+34.59 mln
27.68%
jan 1, 1974
233.489 mln
+73.948 mln
46.35%
jan 1, 1975
289.147 mln
+55.658 mln
23.84%
jan 1, 1976
304.707 mln
+15.56 mln
5.38%
jan 1, 1977
333.884 mln
+29.177 mln
9.58%
jan 1, 1978
404.184 mln
+70.299 mln
21.05%
jan 1, 1979
458.282 mln
+54.098 mln
13.38%
jan 1, 1980
531.956 mln
+73.673 mln
16.08%
jan 1, 1981
620.281 mln
+88.325 mln
16.6%
jan 1, 1982
646.04 mln
+25.759 mln
4.15%
jan 1, 1983
622.773 mln
-23.266 mln
-3.6%
jan 1, 1984
567.083 mln
-55.69 mln
-8.94%
jan 1, 1985
544.221 mln
-22.862 mln
-4.03%
jan 1, 1986
564.969 mln
+20.748 mln
3.81%
jan 1, 1987
725.107 mln
+160.138 mln
28.34%
jan 1, 1988
918.198 mln
+193.091 mln
26.63%
jan 1, 1989
1.018 bln
+100.154 mln
10.91%
jan 1, 1990
991.136 mln
-27.217 mln
-2.67%
jan 1, 1991
1.135 bln
+143.602 mln
14.49%
jan 1, 1992
1.122 bln
-12.304 mln
-1.08%
jan 1, 1993
1.127 bln
+4.801 mln
0.43%
jan 1, 1994
965.781 mln
-161.454 mln
-14.32%
jan 1, 1995
935.137 mln
-30.644 mln
-3.17%
jan 1, 1996
1.003 bln
+67.614 mln
7.23%
jan 1, 1997
977.401 mln
-25.35 mln
-2.53%
jan 1, 1998
909.776 mln
-67.625 mln
-6.92%
jan 1, 1999
980.505 mln
+70.73 mln
7.77%
jan 1, 2000
1.104 bln
+123.119 mln
12.56%
jan 1, 2001
1.103 bln
-948.072K
-0.09%
jan 1, 2002
1.065 bln
-38.14 mln
-3.46%
jan 1, 2003
1.191 bln
+126.168 mln
11.85%
jan 1, 2004
1.472 bln
+281.613 mln
23.65%
jan 1, 2005
1.71 bln
+238.113 mln
16.17%
jan 1, 2006
2.11 bln
+400.024 mln
23.39%
jan 1, 2007
2.315 bln
+204.479 mln
9.69%
jan 1, 2008
2.968 bln
+652.642 mln
28.19%
jan 1, 2009
2.857 bln
-110.485 mln
-3.72%
jan 1, 2010
2.397 bln
-459.598 mln
-16.09%
jan 1, 2011
2.383 bln
-14.534 mln
-0.61%
jan 1, 2012
2.501 bln
+118.353 mln
4.97%
jan 1, 2013
2.423 bln
-77.868 mln
-3.11%
jan 1, 2014
2.523 bln
+99.124 mln
4.09%
jan 1, 2015
2.856 bln
+333.209 mln
13.21%
Ranking of countries by current statistics by years


Comments: