29
/
en
AIzaSyAYiBZKx7MnpbEhh9jyipgxe19OcubqV5w
April 1, 2024
180511
Liechtenstein
LIE
true
2
1
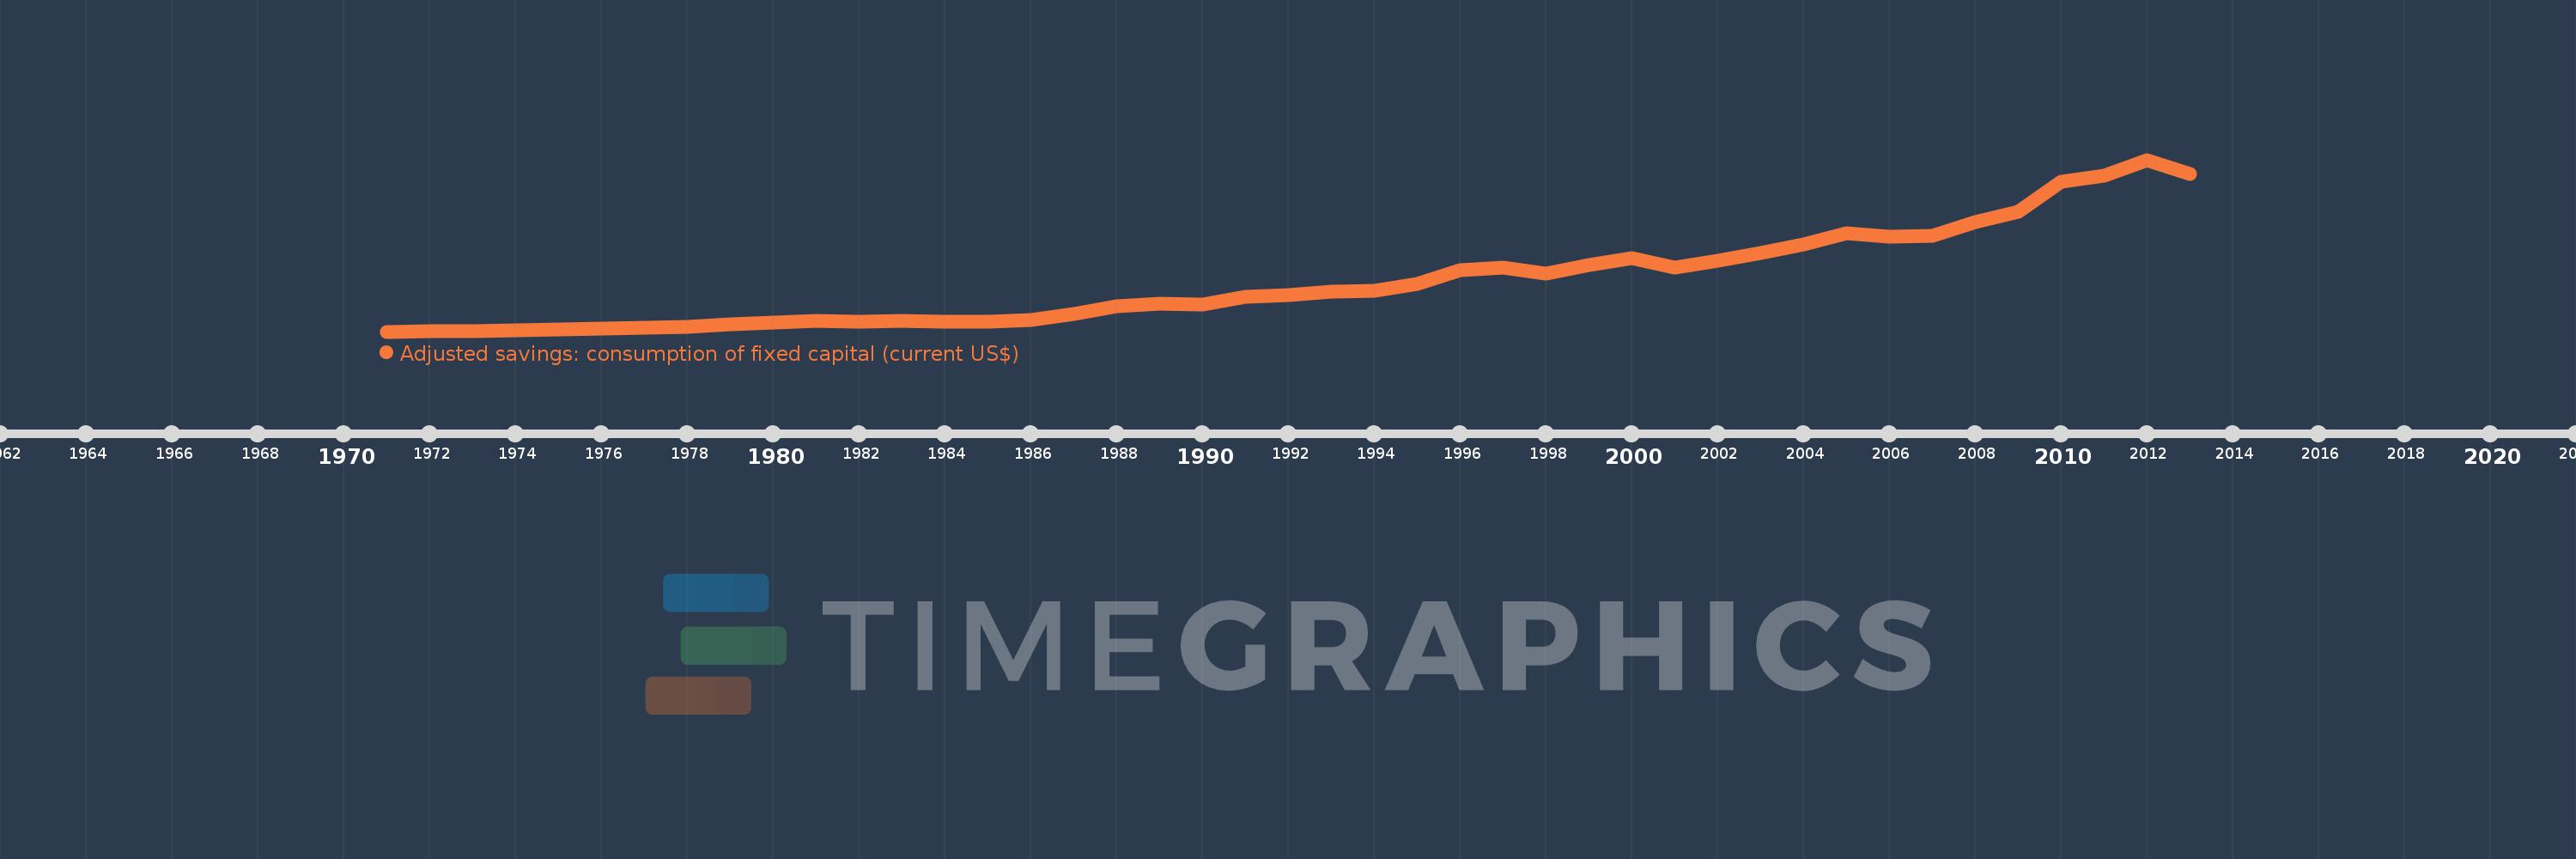
Adjusted savings: consumption of fixed capital (current US$)
2013,2012,2011,2010,2009,2008,2007,2006,2005,2004,2003,2002,2001,2000,1999,1998,1997,1996,1995,1994,1993,1992,1991,1990,1989,1988,1987,1986,1985,1984,1983,1982,1981,1980,1979,1978,1977,1976,1975,1974,1973,1972,1971
This statistics in other country:
AfghanistanAlbaniaAlgeriaAndorraAngolaAntigua and BarbudaArgentinaArmeniaArubaAustraliaAustriaAzerbaijanBahamas, TheBahrainBangladeshBarbadosBelarusBelgiumBelizeBeninBermudaBhutanBoliviaBosnia and HerzegovinaBotswanaBrazilBrunei DarussalamBulgariaBurkina FasoBurundiCabo VerdeCambodiaCameroonCanadaCayman IslandsCentral African RepublicChadChannel IslandsChileChinaColombiaComorosCongo, Dem. Rep.Congo, Rep.Costa RicaCote d'IvoireCroatiaCubaCyprusCzech RepublicDenmarkDjiboutiDominicaDominican RepublicEcuadorEgypt, Arab Rep.El SalvadorEquatorial GuineaEritreaEstoniaEthiopiaFaroe IslandsFijiFinlandFranceFrench PolynesiaGabonGambia, TheGeorgiaGermanyGhanaGreeceGreenlandGrenadaGuatemalaGuineaGuinea-BissauGuyanaHaitiHondurasHong Kong SAR, ChinaHungaryIcelandIndiaIndonesiaIran, Islamic Rep.IraqIrelandIsle of ManIsraelItalyJamaicaJapanJordanKazakhstanKenyaKiribatiKorea, Rep.KosovoKuwaitKyrgyz RepublicLao PDRLatviaLebanonLesothoLiberiaLibyaLiechtensteinLithuaniaLuxembourgMacao SAR, ChinaMacedonia, FYRMadagascarMalawiMalaysiaMaldivesMaliMaltaMarshall IslandsMauritaniaMauritiusMexicoMicronesia, Fed. Sts.MoldovaMonacoMongoliaMontenegroMoroccoMozambiqueMyanmarNamibiaNepalNetherlandsNew CaledoniaNew ZealandNicaraguaNigerNigeriaNorwayOmanPakistanPalauPanamaPapua New GuineaParaguayPeruPhilippinesPolandPortugalPuerto RicoQatarRomaniaRussian FederationRwandaSamoaSan MarinoSao Tome and PrincipeSaudi ArabiaSenegalSerbiaSeychellesSierra LeoneSingaporeSlovak RepublicSloveniaSolomon IslandsSomaliaSouth AfricaSouth SudanSpainSri LankaSt. Kitts and NevisSt. LuciaSt. Vincent and the GrenadinesSudanSurinameSwazilandSwedenSwitzerlandSyrian Arab RepublicTajikistanTanzaniaThailandTimor-LesteTogoTongaTrinidad and TobagoTunisiaTurkeyTurkmenistanTuvaluUgandaUkraineUnited Arab EmiratesUnited KingdomUnited StatesUruguayUzbekistanVanuatuVenezuela, RBVietnamVirgin Islands (U.S.)West Bank and GazaYemen, Rep.ZambiaZimbabwe Timeline:
This timeline shows a graph from 1971 to 2013 of Liechtenstein. No data until 1970. Number of actual observations by date: 43.
Source name:
World Development Indicators
Source organization:
World Bank staff estimates using data from the United Nations Statistics Division's National Accounts Statistics.
Categories, topics:
Economy & Growth, Environment
Last updated:
apr 23, 2017
Indicators value changes by year
Minimum:
7.329 mln
jan 1, 1971
Maximum:
734.087 mln
jan 1, 2012
At the date of observation
Value
Absolute change
Change from previous value
jan 1, 1971
7.329 mln
+7.329 mln
0.0%
jan 1, 1972
8.528 mln
+1.199 mln
16.36%
jan 1, 1973
10.155 mln
+1.627 mln
19.08%
jan 1, 1974
13.481 mln
+3.326 mln
32.75%
jan 1, 1975
15.761 mln
+2.28 mln
16.91%
jan 1, 1976
21.331 mln
+5.57 mln
35.34%
jan 1, 1977
23.638 mln
+2.307 mln
10.82%
jan 1, 1978
26.449 mln
+2.811 mln
11.89%
jan 1, 1979
38.159 mln
+11.71 mln
44.28%
jan 1, 1980
43.918 mln
+5.758 mln
15.09%
jan 1, 1981
53.104 mln
+9.187 mln
20.92%
jan 1, 1982
50.645 mln
-2.46 mln
-4.63%
jan 1, 1983
50.938 mln
+293.063K
0.58%
jan 1, 1984
50.887 mln
-50.384K
-0.1%
jan 1, 1985
48.786 mln
-2.101 mln
-4.13%
jan 1, 1986
56.297 mln
+7.511 mln
15.4%
jan 1, 1987
83.229 mln
+26.932 mln
47.84%
jan 1, 1988
113.276 mln
+30.047 mln
36.1%
jan 1, 1989
125.093 mln
+11.817 mln
10.43%
jan 1, 1990
120.884 mln
-4.209 mln
-3.36%
jan 1, 1991
153.946 mln
+33.062 mln
27.35%
jan 1, 1992
160.528 mln
+6.582 mln
4.28%
jan 1, 1993
175.674 mln
+15.145 mln
9.43%
jan 1, 1994
179.724 mln
+4.05 mln
2.31%
jan 1, 1995
210.622 mln
+30.898 mln
17.19%
jan 1, 1996
268.48 mln
+57.858 mln
27.47%
jan 1, 1997
277.193 mln
+8.713 mln
3.25%
jan 1, 1998
253.65 mln
-23.543 mln
-8.49%
jan 1, 1999
289.141 mln
+35.491 mln
13.99%
jan 1, 2000
316.612 mln
+27.471 mln
9.5%
jan 1, 2001
277.35 mln
-39.262 mln
-12.4%
jan 1, 2002
307.772 mln
+30.422 mln
10.97%
jan 1, 2003
339.406 mln
+31.634 mln
10.28%
jan 1, 2004
375.376 mln
+35.97 mln
10.6%
jan 1, 2005
422.679 mln
+47.304 mln
12.6%
jan 1, 2006
408.617 mln
-14.063 mln
-3.33%
jan 1, 2007
414.087 mln
+5.47 mln
1.34%
jan 1, 2008
471.19 mln
+57.103 mln
13.79%
jan 1, 2009
512.884 mln
+41.695 mln
8.85%
jan 1, 2010
642.288 mln
+129.403 mln
25.23%
jan 1, 2011
667.27 mln
+24.983 mln
3.89%
jan 1, 2012
734.087 mln
+66.817 mln
10.01%
jan 1, 2013
674.427 mln
-59.66 mln
-8.13%
Ranking of countries by current statistics by years


Comments: