29
/
en
AIzaSyAYiBZKx7MnpbEhh9jyipgxe19OcubqV5w
April 1, 2024
234354
Saudi Arabia
SAU
true
2
1
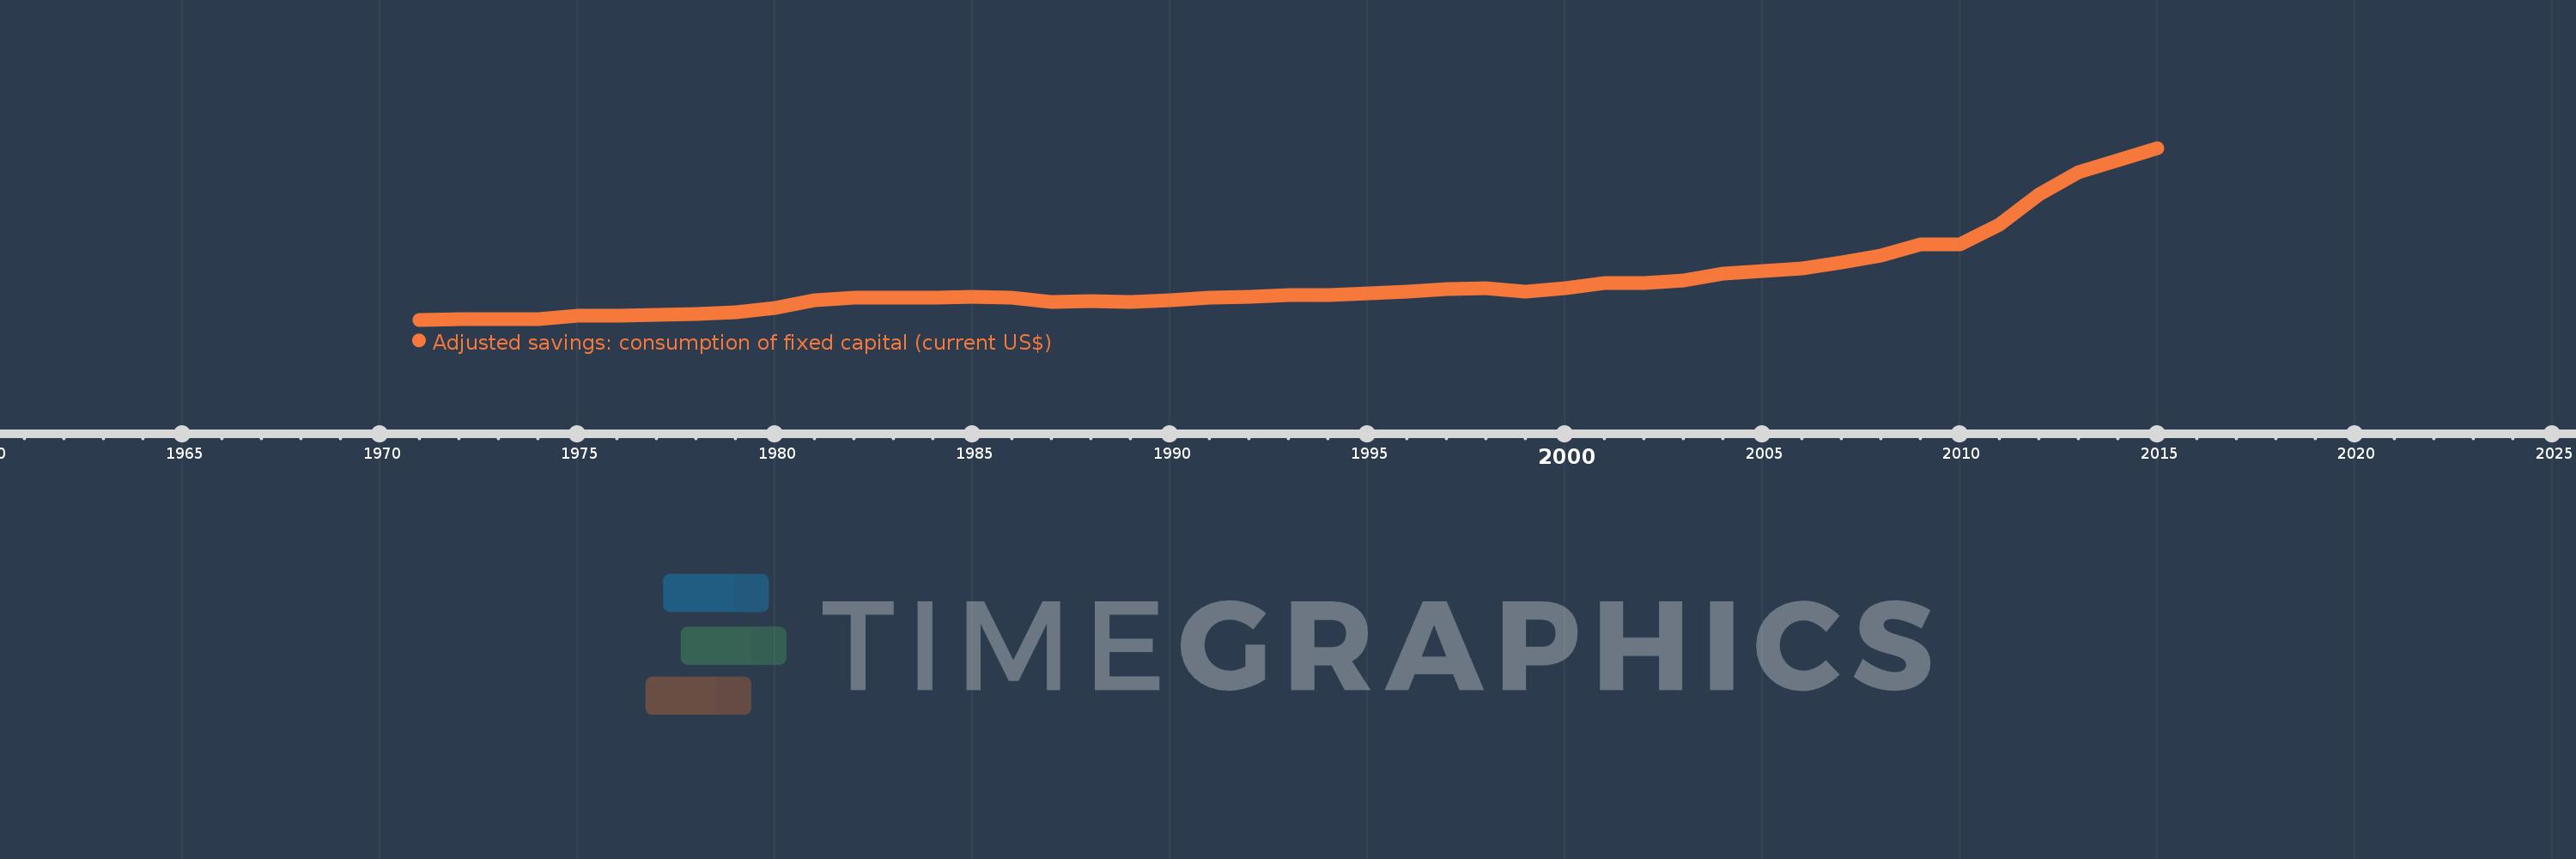
Adjusted savings: consumption of fixed capital (current US$)
2015,2014,2013,2012,2011,2010,2009,2008,2007,2006,2005,2004,2003,2002,2001,2000,1999,1998,1997,1996,1995,1994,1993,1992,1991,1990,1989,1988,1987,1986,1985,1984,1983,1982,1981,1980,1979,1978,1977,1976,1975,1974,1973,1972,1971
This statistics in other country:
AfghanistanAlbaniaAlgeriaAndorraAngolaAntigua and BarbudaArgentinaArmeniaArubaAustraliaAustriaAzerbaijanBahamas, TheBahrainBangladeshBarbadosBelarusBelgiumBelizeBeninBermudaBhutanBoliviaBosnia and HerzegovinaBotswanaBrazilBrunei DarussalamBulgariaBurkina FasoBurundiCabo VerdeCambodiaCameroonCanadaCayman IslandsCentral African RepublicChadChannel IslandsChileChinaColombiaComorosCongo, Dem. Rep.Congo, Rep.Costa RicaCote d'IvoireCroatiaCubaCyprusCzech RepublicDenmarkDjiboutiDominicaDominican RepublicEcuadorEgypt, Arab Rep.El SalvadorEquatorial GuineaEritreaEstoniaEthiopiaFaroe IslandsFijiFinlandFranceFrench PolynesiaGabonGambia, TheGeorgiaGermanyGhanaGreeceGreenlandGrenadaGuatemalaGuineaGuinea-BissauGuyanaHaitiHondurasHong Kong SAR, ChinaHungaryIcelandIndiaIndonesiaIran, Islamic Rep.IraqIrelandIsle of ManIsraelItalyJamaicaJapanJordanKazakhstanKenyaKiribatiKorea, Rep.KosovoKuwaitKyrgyz RepublicLao PDRLatviaLebanonLesothoLiberiaLibyaLiechtensteinLithuaniaLuxembourgMacao SAR, ChinaMacedonia, FYRMadagascarMalawiMalaysiaMaldivesMaliMaltaMarshall IslandsMauritaniaMauritiusMexicoMicronesia, Fed. Sts.MoldovaMonacoMongoliaMontenegroMoroccoMozambiqueMyanmarNamibiaNepalNetherlandsNew CaledoniaNew ZealandNicaraguaNigerNigeriaNorwayOmanPakistanPalauPanamaPapua New GuineaParaguayPeruPhilippinesPolandPortugalPuerto RicoQatarRomaniaRussian FederationRwandaSamoaSan MarinoSao Tome and PrincipeSaudi ArabiaSenegalSerbiaSeychellesSierra LeoneSingaporeSlovak RepublicSloveniaSolomon IslandsSomaliaSouth AfricaSouth SudanSpainSri LankaSt. Kitts and NevisSt. LuciaSt. Vincent and the GrenadinesSudanSurinameSwazilandSwedenSwitzerlandSyrian Arab RepublicTajikistanTanzaniaThailandTimor-LesteTogoTongaTrinidad and TobagoTunisiaTurkeyTurkmenistanTuvaluUgandaUkraineUnited Arab EmiratesUnited KingdomUnited StatesUruguayUzbekistanVanuatuVenezuela, RBVietnamVirgin Islands (U.S.)West Bank and GazaYemen, Rep.ZambiaZimbabwe Timeline:
This timeline shows a graph from 1971 to 2015 of Saudi Arabia. No data until 1970. Number of actual observations by date: 45.
Source name:
World Development Indicators
Source organization:
World Bank staff estimates using data from the United Nations Statistics Division's National Accounts Statistics.
Categories, topics:
Economy & Growth, Environment
Last updated:
apr 23, 2017
Indicators value changes by year
Minimum:
373.598 mln
jan 1, 1971
Maximum:
74.978 bln
jan 1, 2015
At the date of observation
Value
Absolute change
Change from previous value
jan 1, 1971
373.598 mln
+373.598 mln
0.0%
jan 1, 1972
482.425 mln
+108.828 mln
29.13%
jan 1, 1973
553.867 mln
+71.442 mln
14.81%
jan 1, 1974
731.427 mln
+177.559 mln
32.06%
jan 1, 1975
2.015 bln
+1.284 bln
175.51%
jan 1, 1976
1.964 bln
-50.887 mln
-2.53%
jan 1, 1977
2.483 bln
+518.966 mln
26.42%
jan 1, 1978
2.955 bln
+471.559 mln
18.99%
jan 1, 1979
3.649 bln
+693.963 mln
23.49%
jan 1, 1980
5.557 bln
+1.908 bln
52.3%
jan 1, 1981
8.811 bln
+3.254 bln
58.56%
jan 1, 1982
10.115 bln
+1.304 bln
14.8%
jan 1, 1983
10.034 bln
-81.037 mln
-0.8%
jan 1, 1984
9.982 bln
-52.169 mln
-0.52%
jan 1, 1985
10.358 bln
+376.161 mln
3.77%
jan 1, 1986
10.079 bln
-279.777 mln
-2.7%
jan 1, 1987
8.13 bln
-1.948 bln
-19.33%
jan 1, 1988
8.483 bln
+352.639 mln
4.34%
jan 1, 1989
8.255 bln
-227.86 mln
-2.69%
jan 1, 1990
8.85 bln
+594.662 mln
7.2%
jan 1, 1991
10.006 bln
+1.156 bln
13.07%
jan 1, 1992
10.51 bln
+504.477 mln
5.04%
jan 1, 1993
10.985 bln
+474.209 mln
4.51%
jan 1, 1994
11.136 bln
+151.13 mln
1.38%
jan 1, 1995
11.911 bln
+774.719 mln
6.96%
jan 1, 1996
12.72 bln
+809.267 mln
6.79%
jan 1, 1997
13.842 bln
+1.122 bln
8.82%
jan 1, 1998
14.193 bln
+351.264 mln
2.54%
jan 1, 1999
12.456 bln
-1.737 bln
-12.24%
jan 1, 2000
14.186 bln
+1.731 bln
13.89%
jan 1, 2001
16.37 bln
+2.184 bln
15.39%
jan 1, 2002
16.409 bln
+38.315 mln
0.23%
jan 1, 2003
17.487 bln
+1.079 bln
6.57%
jan 1, 2004
20.254 bln
+2.767 bln
15.82%
jan 1, 2005
21.62 bln
+1.365 bln
6.74%
jan 1, 2006
22.829 bln
+1.209 bln
5.59%
jan 1, 2007
25.419 bln
+2.59 bln
11.34%
jan 1, 2008
28.421 bln
+3.002 bln
11.81%
jan 1, 2009
32.98 bln
+4.559 bln
16.04%
jan 1, 2010
33.203 bln
+223.101 mln
0.68%
jan 1, 2011
41.795 bln
+8.592 bln
25.88%
jan 1, 2012
54.839 bln
+13.044 bln
31.21%
jan 1, 2013
64.413 bln
+9.573 bln
17.46%
jan 1, 2014
69.679 bln
+5.266 bln
8.18%
jan 1, 2015
74.978 bln
+5.299 bln
7.61%
Ranking of countries by current statistics by years


Comments: