29
/
en
AIzaSyAYiBZKx7MnpbEhh9jyipgxe19OcubqV5w
April 1, 2024
186111
Malawi
MWI
true
2
1
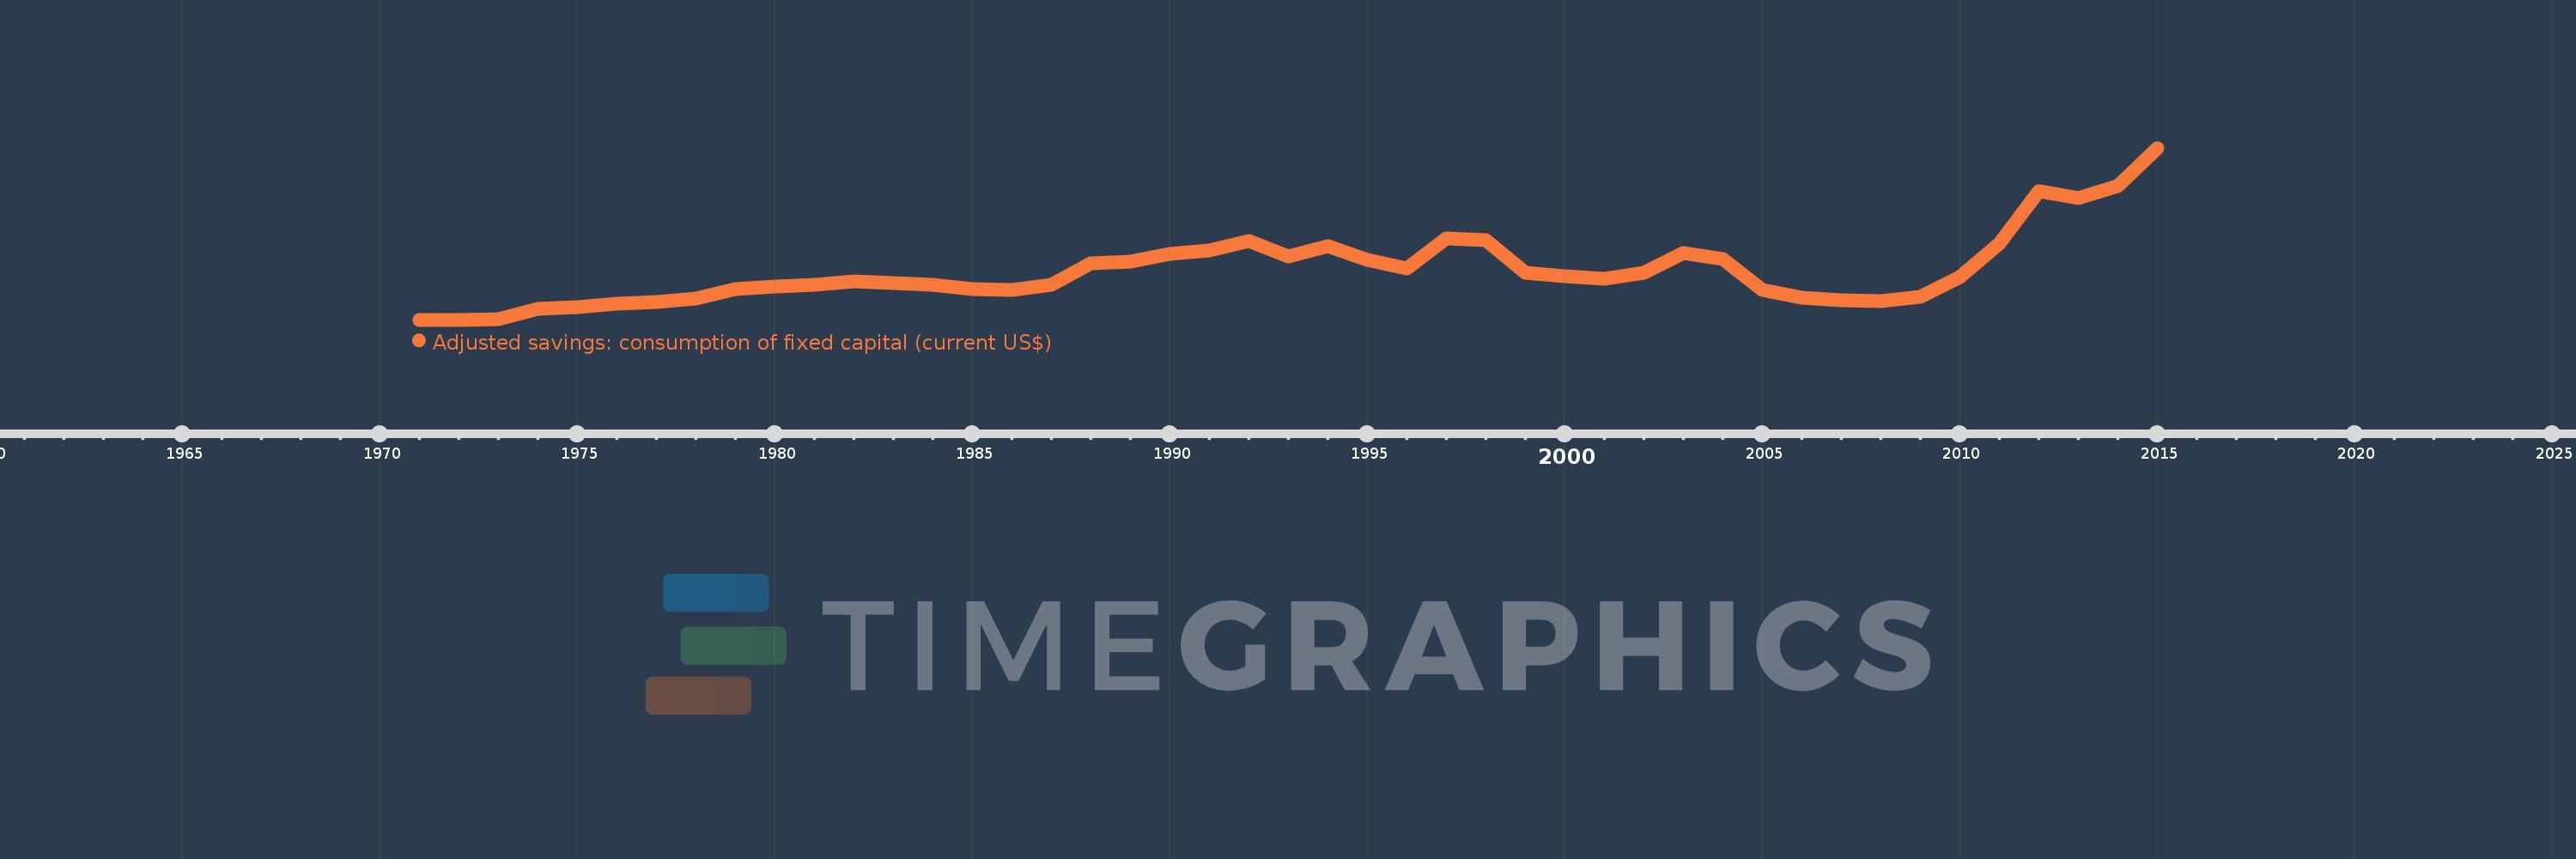
Adjusted savings: consumption of fixed capital (current US$)
2015,2014,2013,2012,2011,2010,2009,2008,2007,2006,2005,2004,2003,2002,2001,2000,1999,1998,1997,1996,1995,1994,1993,1992,1991,1990,1989,1988,1987,1986,1985,1984,1983,1982,1981,1980,1979,1978,1977,1976,1975,1974,1973,1972,1971
This statistics in other country:
AfghanistanAlbaniaAlgeriaAndorraAngolaAntigua and BarbudaArgentinaArmeniaArubaAustraliaAustriaAzerbaijanBahamas, TheBahrainBangladeshBarbadosBelarusBelgiumBelizeBeninBermudaBhutanBoliviaBosnia and HerzegovinaBotswanaBrazilBrunei DarussalamBulgariaBurkina FasoBurundiCabo VerdeCambodiaCameroonCanadaCayman IslandsCentral African RepublicChadChannel IslandsChileChinaColombiaComorosCongo, Dem. Rep.Congo, Rep.Costa RicaCote d'IvoireCroatiaCubaCyprusCzech RepublicDenmarkDjiboutiDominicaDominican RepublicEcuadorEgypt, Arab Rep.El SalvadorEquatorial GuineaEritreaEstoniaEthiopiaFaroe IslandsFijiFinlandFranceFrench PolynesiaGabonGambia, TheGeorgiaGermanyGhanaGreeceGreenlandGrenadaGuatemalaGuineaGuinea-BissauGuyanaHaitiHondurasHong Kong SAR, ChinaHungaryIcelandIndiaIndonesiaIran, Islamic Rep.IraqIrelandIsle of ManIsraelItalyJamaicaJapanJordanKazakhstanKenyaKiribatiKorea, Rep.KosovoKuwaitKyrgyz RepublicLao PDRLatviaLebanonLesothoLiberiaLibyaLiechtensteinLithuaniaLuxembourgMacao SAR, ChinaMacedonia, FYRMadagascarMalawiMalaysiaMaldivesMaliMaltaMarshall IslandsMauritaniaMauritiusMexicoMicronesia, Fed. Sts.MoldovaMonacoMongoliaMontenegroMoroccoMozambiqueMyanmarNamibiaNepalNetherlandsNew CaledoniaNew ZealandNicaraguaNigerNigeriaNorwayOmanPakistanPalauPanamaPapua New GuineaParaguayPeruPhilippinesPolandPortugalPuerto RicoQatarRomaniaRussian FederationRwandaSamoaSan MarinoSao Tome and PrincipeSaudi ArabiaSenegalSerbiaSeychellesSierra LeoneSingaporeSlovak RepublicSloveniaSolomon IslandsSomaliaSouth AfricaSouth SudanSpainSri LankaSt. Kitts and NevisSt. LuciaSt. Vincent and the GrenadinesSudanSurinameSwazilandSwedenSwitzerlandSyrian Arab RepublicTajikistanTanzaniaThailandTimor-LesteTogoTongaTrinidad and TobagoTunisiaTurkeyTurkmenistanTuvaluUgandaUkraineUnited Arab EmiratesUnited KingdomUnited StatesUruguayUzbekistanVanuatuVenezuela, RBVietnamVirgin Islands (U.S.)West Bank and GazaYemen, Rep.ZambiaZimbabwe Timeline:
This timeline shows a graph from 1971 to 2015 of Malawi. No data until 1970. Number of actual observations by date: 45.
Source name:
World Development Indicators
Source organization:
World Bank staff estimates using data from the United Nations Statistics Division's National Accounts Statistics.
Categories, topics:
Economy & Growth, Environment
Last updated:
apr 23, 2017
Indicators value changes by year
Minimum:
1.17 mln
jan 1, 1971
Maximum:
366.731 mln
jan 1, 2015
At the date of observation
Value
Absolute change
Change from previous value
jan 1, 1971
1.17 mln
+1.17 mln
0.0%
jan 1, 1972
1.472 mln
+301.525K
25.77%
jan 1, 1973
1.635 mln
+163.891K
11.14%
jan 1, 1974
23.68 mln
+22.044 mln
1.35K%
jan 1, 1975
28.649 mln
+4.97 mln
20.99%
jan 1, 1976
34.497 mln
+5.848 mln
20.41%
jan 1, 1977
39.868 mln
+5.371 mln
15.57%
jan 1, 1978
46.515 mln
+6.647 mln
16.67%
jan 1, 1979
67.2 mln
+20.685 mln
44.47%
jan 1, 1980
71.876 mln
+4.676 mln
6.96%
jan 1, 1981
74.991 mln
+3.115 mln
4.33%
jan 1, 1982
83.771 mln
+8.78 mln
11.71%
jan 1, 1983
78.66 mln
-5.111 mln
-6.1%
jan 1, 1984
75.39 mln
-3.271 mln
-4.16%
jan 1, 1985
65.701 mln
-9.689 mln
-12.85%
jan 1, 1986
64.215 mln
-1.486 mln
-2.26%
jan 1, 1987
75.849 mln
+11.635 mln
18.12%
jan 1, 1988
121.064 mln
+45.215 mln
59.61%
jan 1, 1989
124.269 mln
+3.205 mln
2.65%
jan 1, 1990
142.274 mln
+18.005 mln
14.49%
jan 1, 1991
149.353 mln
+7.078 mln
4.98%
jan 1, 1992
167.895 mln
+18.543 mln
12.42%
jan 1, 1993
135.332 mln
-32.564 mln
-19.4%
jan 1, 1994
157.784 mln
+22.453 mln
16.59%
jan 1, 1995
128.066 mln
-29.718 mln
-18.83%
jan 1, 1996
110.081 mln
-17.985 mln
-14.04%
jan 1, 1997
174.055 mln
+63.973 mln
58.11%
jan 1, 1998
170.513 mln
-3.541 mln
-2.03%
jan 1, 1999
101.441 mln
-69.072 mln
-40.51%
jan 1, 2000
93.462 mln
-7.979 mln
-7.87%
jan 1, 2001
88.209 mln
-5.253 mln
-5.62%
jan 1, 2002
101.358 mln
+13.148 mln
14.91%
jan 1, 2003
142.405 mln
+41.047 mln
40.5%
jan 1, 2004
129.886 mln
-12.519 mln
-8.79%
jan 1, 2005
65.038 mln
-64.848 mln
-49.93%
jan 1, 2006
48.882 mln
-16.156 mln
-24.84%
jan 1, 2007
42.633 mln
-6.249 mln
-12.78%
jan 1, 2008
40.584 mln
-2.049 mln
-4.81%
jan 1, 2009
50.505 mln
+9.921 mln
24.45%
jan 1, 2010
92.058 mln
+41.553 mln
82.28%
jan 1, 2011
163.281 mln
+71.223 mln
77.37%
jan 1, 2012
275.587 mln
+112.306 mln
68.78%
jan 1, 2013
260.172 mln
-15.415 mln
-5.59%
jan 1, 2014
286.373 mln
+26.201 mln
10.07%
jan 1, 2015
366.731 mln
+80.358 mln
28.06%
Ranking of countries by current statistics by years


Comments: