29
/
en
AIzaSyAYiBZKx7MnpbEhh9jyipgxe19OcubqV5w
April 1, 2024
161163
Italy
ITA
true
2
1
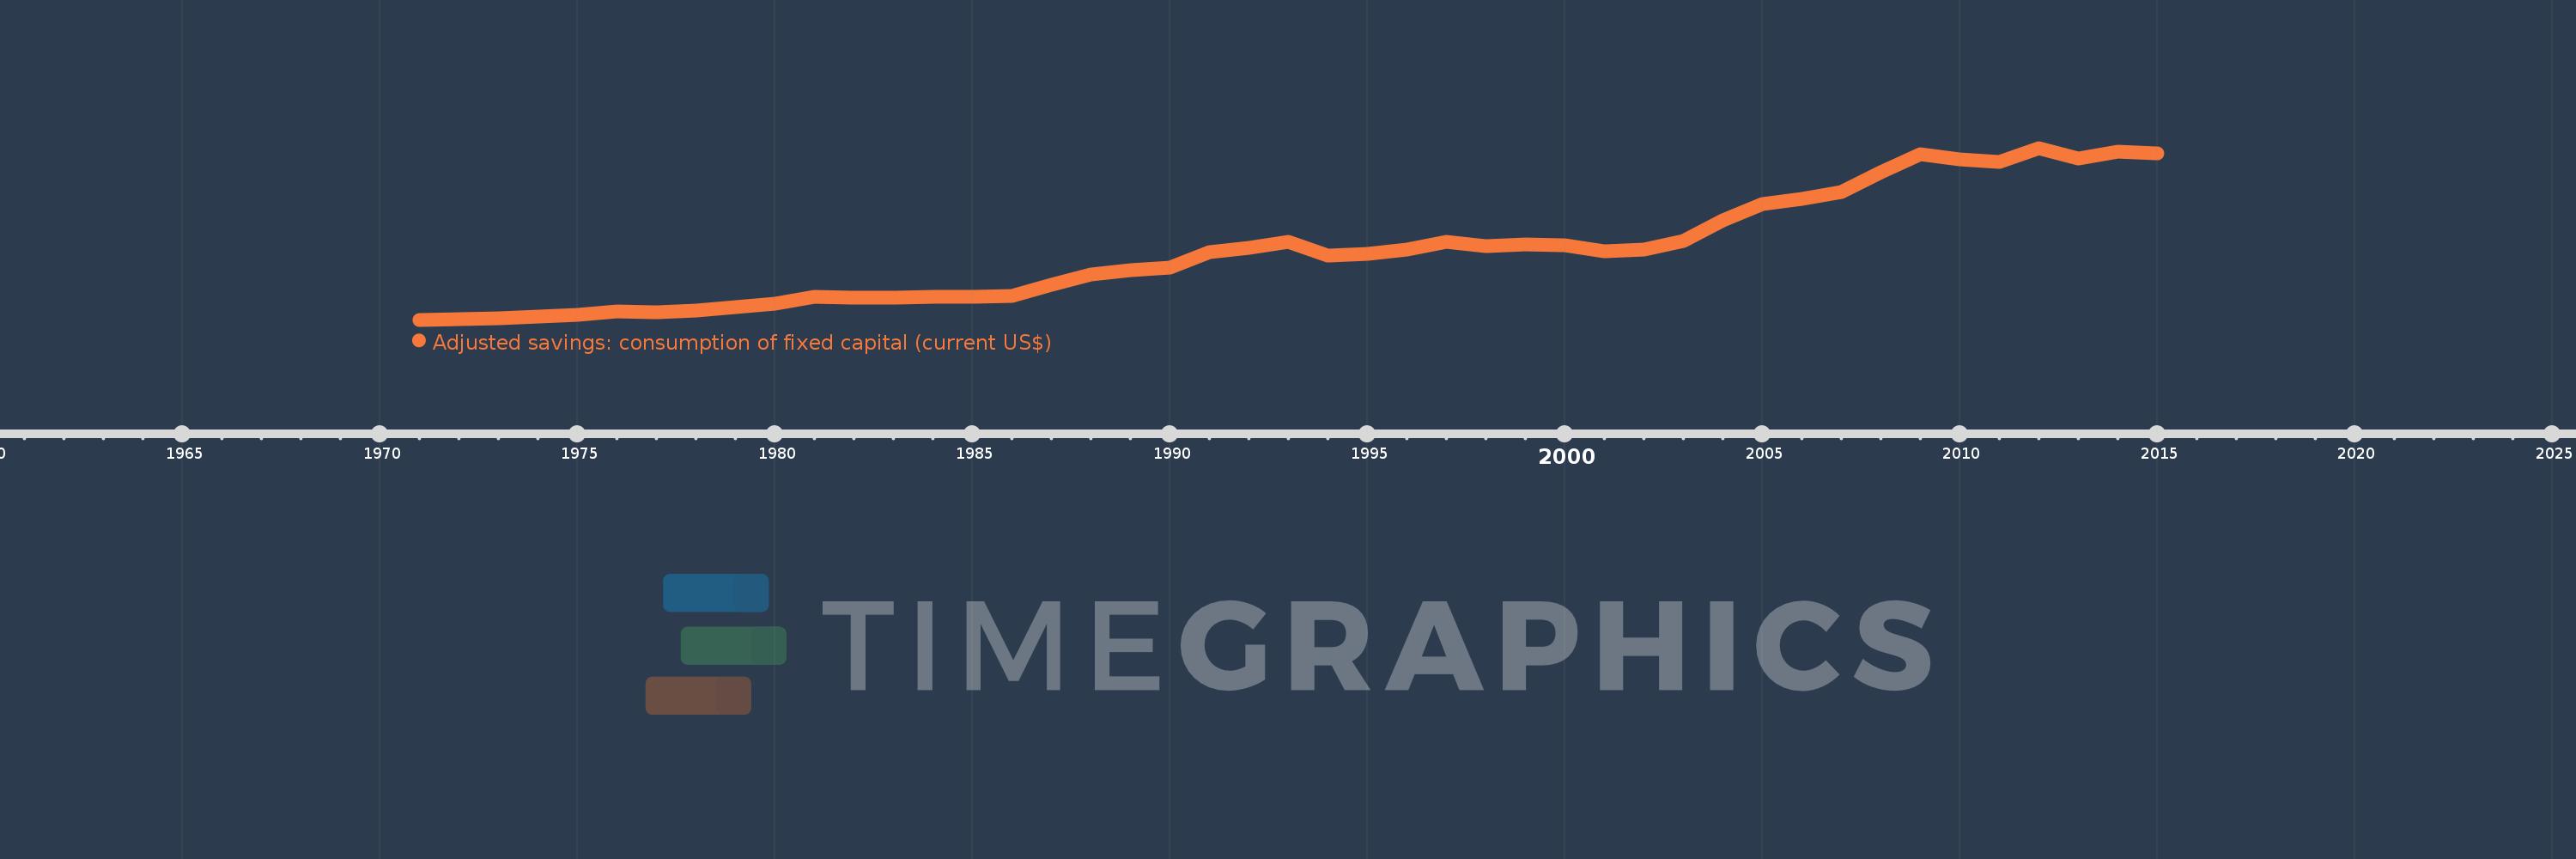
Adjusted savings: consumption of fixed capital (current US$)
2015,2014,2013,2012,2011,2010,2009,2008,2007,2006,2005,2004,2003,2002,2001,2000,1999,1998,1997,1996,1995,1994,1993,1992,1991,1990,1989,1988,1987,1986,1985,1984,1983,1982,1981,1980,1979,1978,1977,1976,1975,1974,1973,1972,1971
This statistics in other country:
AfghanistanAlbaniaAlgeriaAndorraAngolaAntigua and BarbudaArgentinaArmeniaArubaAustraliaAustriaAzerbaijanBahamas, TheBahrainBangladeshBarbadosBelarusBelgiumBelizeBeninBermudaBhutanBoliviaBosnia and HerzegovinaBotswanaBrazilBrunei DarussalamBulgariaBurkina FasoBurundiCabo VerdeCambodiaCameroonCanadaCayman IslandsCentral African RepublicChadChannel IslandsChileChinaColombiaComorosCongo, Dem. Rep.Congo, Rep.Costa RicaCote d'IvoireCroatiaCubaCyprusCzech RepublicDenmarkDjiboutiDominicaDominican RepublicEcuadorEgypt, Arab Rep.El SalvadorEquatorial GuineaEritreaEstoniaEthiopiaFaroe IslandsFijiFinlandFranceFrench PolynesiaGabonGambia, TheGeorgiaGermanyGhanaGreeceGreenlandGrenadaGuatemalaGuineaGuinea-BissauGuyanaHaitiHondurasHong Kong SAR, ChinaHungaryIcelandIndiaIndonesiaIran, Islamic Rep.IraqIrelandIsle of ManIsraelItalyJamaicaJapanJordanKazakhstanKenyaKiribatiKorea, Rep.KosovoKuwaitKyrgyz RepublicLao PDRLatviaLebanonLesothoLiberiaLibyaLiechtensteinLithuaniaLuxembourgMacao SAR, ChinaMacedonia, FYRMadagascarMalawiMalaysiaMaldivesMaliMaltaMarshall IslandsMauritaniaMauritiusMexicoMicronesia, Fed. Sts.MoldovaMonacoMongoliaMontenegroMoroccoMozambiqueMyanmarNamibiaNepalNetherlandsNew CaledoniaNew ZealandNicaraguaNigerNigeriaNorwayOmanPakistanPalauPanamaPapua New GuineaParaguayPeruPhilippinesPolandPortugalPuerto RicoQatarRomaniaRussian FederationRwandaSamoaSan MarinoSao Tome and PrincipeSaudi ArabiaSenegalSerbiaSeychellesSierra LeoneSingaporeSlovak RepublicSloveniaSolomon IslandsSomaliaSouth AfricaSouth SudanSpainSri LankaSt. Kitts and NevisSt. LuciaSt. Vincent and the GrenadinesSudanSurinameSwazilandSwedenSwitzerlandSyrian Arab RepublicTajikistanTanzaniaThailandTimor-LesteTogoTongaTrinidad and TobagoTunisiaTurkeyTurkmenistanTuvaluUgandaUkraineUnited Arab EmiratesUnited KingdomUnited StatesUruguayUzbekistanVanuatuVenezuela, RBVietnamVirgin Islands (U.S.)West Bank and GazaYemen, Rep.ZambiaZimbabwe Timeline:
This timeline shows a graph from 1971 to 2015 of Italy. No data until 1970. Number of actual observations by date: 45.
Source name:
World Development Indicators
Source organization:
World Bank staff estimates using data from the United Nations Statistics Division's National Accounts Statistics.
Categories, topics:
Economy & Growth, Environment
Last updated:
apr 23, 2017
Indicators value changes by year
Minimum:
12.801 bln
jan 1, 1971
Maximum:
402.71 bln
jan 1, 2012
At the date of observation
Value
Absolute change
Change from previous value
jan 1, 1971
12.801 bln
+12.801 bln
0.0%
jan 1, 1972
13.961 bln
+1.16 bln
9.06%
jan 1, 1973
16.327 bln
+2.366 bln
16.94%
jan 1, 1974
20.138 bln
+3.811 bln
23.34%
jan 1, 1975
24.399 bln
+4.262 bln
21.16%
jan 1, 1976
30.872 bln
+6.473 bln
26.53%
jan 1, 1977
29.601 bln
-1.271 bln
-4.12%
jan 1, 1978
34.379 bln
+4.777 bln
16.14%
jan 1, 1979
41.114 bln
+6.735 bln
19.59%
jan 1, 1980
49.639 bln
+8.525 bln
20.74%
jan 1, 1981
65.741 bln
+16.102 bln
32.44%
jan 1, 1982
63.087 bln
-2.654 bln
-4.04%
jan 1, 1983
63.534 bln
+447.894 mln
0.71%
jan 1, 1984
65.319 bln
+1.785 bln
2.81%
jan 1, 1985
64.096 bln
-1.223 bln
-1.87%
jan 1, 1986
66.766 bln
+2.669 bln
4.16%
jan 1, 1987
92.235 bln
+25.47 bln
38.15%
jan 1, 1988
115.178 bln
+22.943 bln
24.87%
jan 1, 1989
126.079 bln
+10.901 bln
9.46%
jan 1, 1990
131.261 bln
+5.181 bln
4.11%
jan 1, 1991
165.662 bln
+34.402 bln
26.21%
jan 1, 1992
175.379 bln
+9.716 bln
5.87%
jan 1, 1993
189.37 bln
+13.991 bln
7.98%
jan 1, 1994
157.556 bln
-31.814 bln
-16.8%
jan 1, 1995
162.273 bln
+4.717 bln
2.99%
jan 1, 1996
171.131 bln
+8.857 bln
5.46%
jan 1, 1997
189.719 bln
+18.588 bln
10.86%
jan 1, 1998
179.624 bln
-10.095 bln
-5.32%
jan 1, 1999
184.15 bln
+4.526 bln
2.52%
jan 1, 2000
182.75 bln
-1.4 bln
-0.76%
jan 1, 2001
168.054 bln
-14.696 bln
-8.04%
jan 1, 2002
171.743 bln
+3.689 bln
2.2%
jan 1, 2003
191.46 bln
+19.717 bln
11.48%
jan 1, 2004
238.021 bln
+46.561 bln
24.32%
jan 1, 2005
274.668 bln
+36.647 bln
15.4%
jan 1, 2006
288.065 bln
+13.396 bln
4.88%
jan 1, 2007
303.644 bln
+15.579 bln
5.41%
jan 1, 2008
346.856 bln
+43.212 bln
14.23%
jan 1, 2009
388.488 bln
+41.632 bln
12.0%
jan 1, 2010
375.837 bln
-12.651 bln
-3.26%
jan 1, 2011
371.021 bln
-4.816 bln
-1.28%
jan 1, 2012
402.71 bln
+31.689 bln
8.54%
jan 1, 2013
378.939 bln
-23.771 bln
-5.9%
jan 1, 2014
393.406 bln
+14.467 bln
3.82%
jan 1, 2015
391.327 bln
-2.079 bln
-0.53%
Ranking of countries by current statistics by years


Comments: