29
/
en
AIzaSyAYiBZKx7MnpbEhh9jyipgxe19OcubqV5w
April 1, 2024
151306
Hong Kong SAR, China
HKG
true
2
1
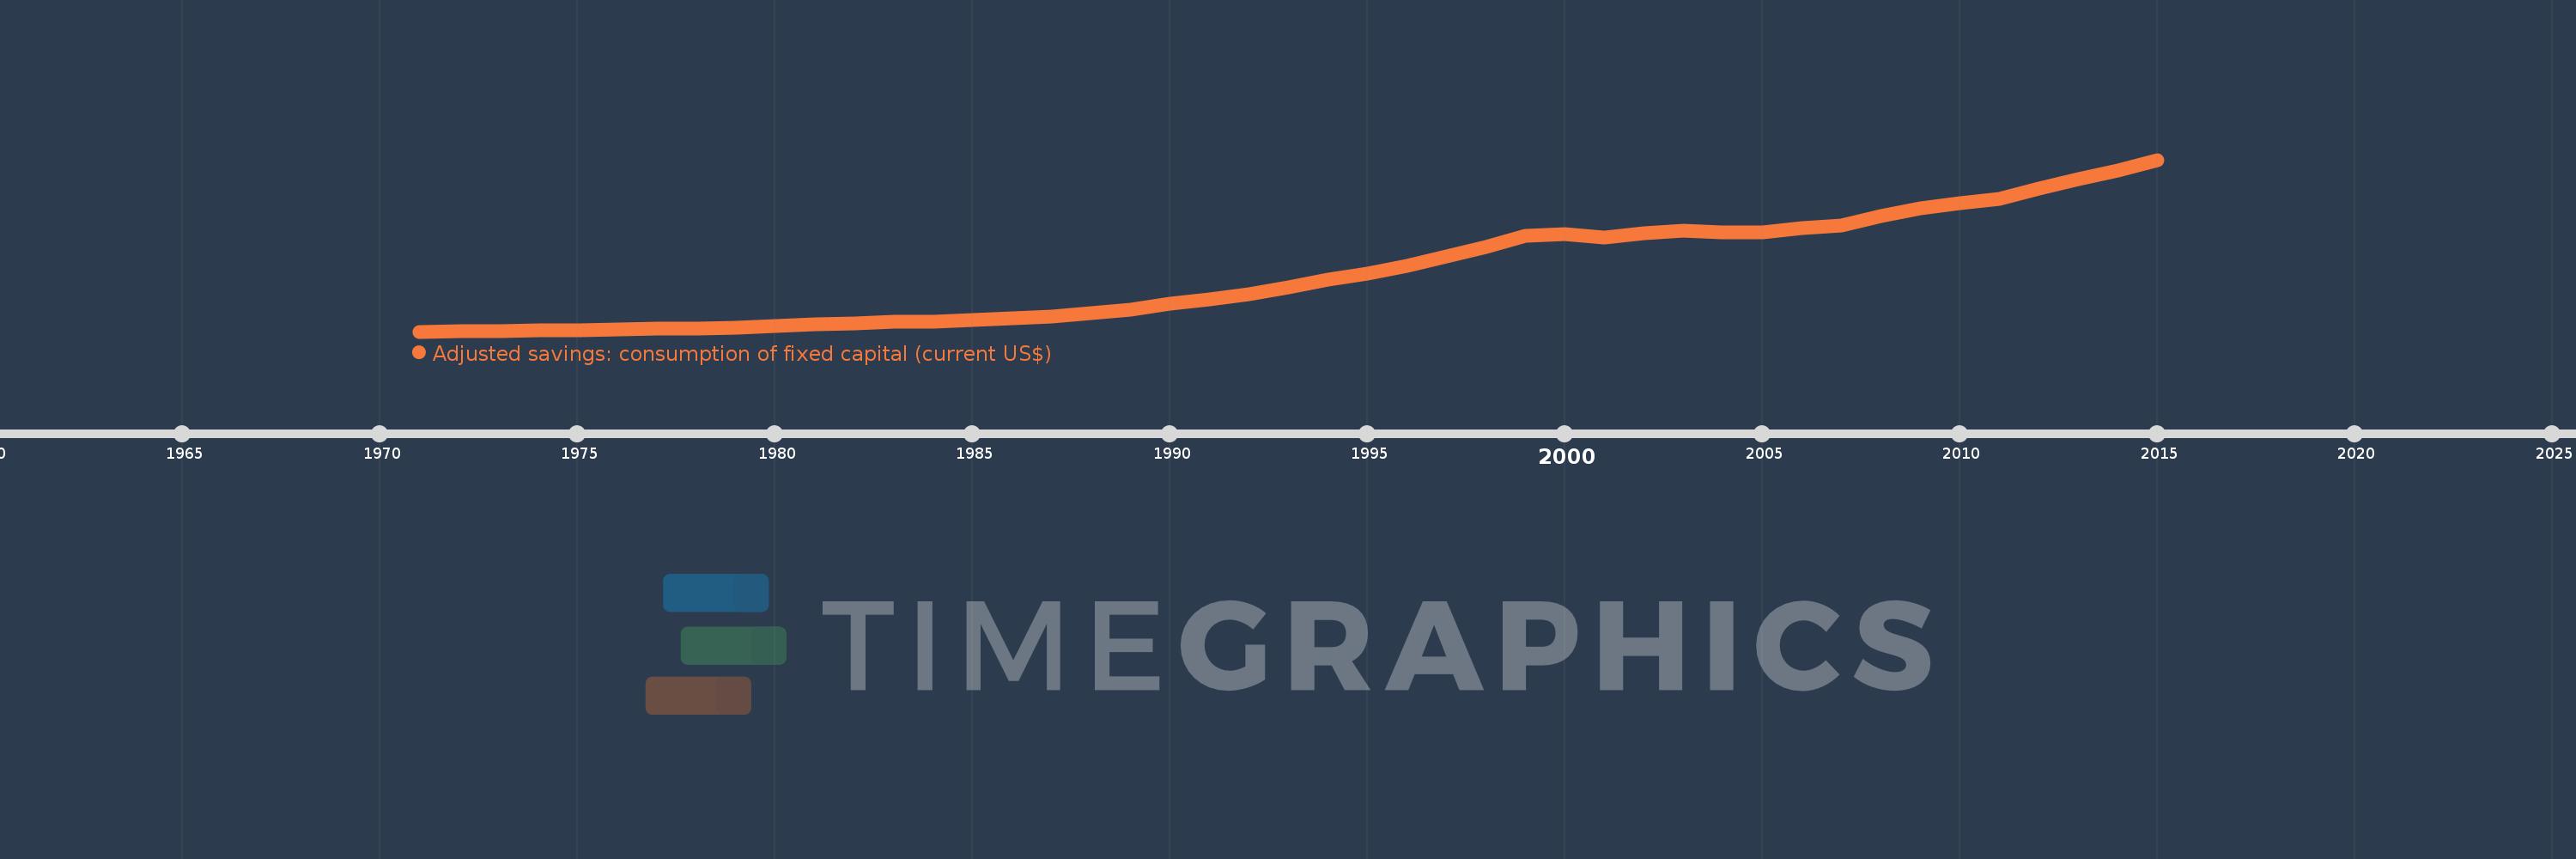
Adjusted savings: consumption of fixed capital (current US$)
2015,2014,2013,2012,2011,2010,2009,2008,2007,2006,2005,2004,2003,2002,2001,2000,1999,1998,1997,1996,1995,1994,1993,1992,1991,1990,1989,1988,1987,1986,1985,1984,1983,1982,1981,1980,1979,1978,1977,1976,1975,1974,1973,1972,1971
This statistics in other country:
AfghanistanAlbaniaAlgeriaAndorraAngolaAntigua and BarbudaArgentinaArmeniaArubaAustraliaAustriaAzerbaijanBahamas, TheBahrainBangladeshBarbadosBelarusBelgiumBelizeBeninBermudaBhutanBoliviaBosnia and HerzegovinaBotswanaBrazilBrunei DarussalamBulgariaBurkina FasoBurundiCabo VerdeCambodiaCameroonCanadaCayman IslandsCentral African RepublicChadChannel IslandsChileChinaColombiaComorosCongo, Dem. Rep.Congo, Rep.Costa RicaCote d'IvoireCroatiaCubaCyprusCzech RepublicDenmarkDjiboutiDominicaDominican RepublicEcuadorEgypt, Arab Rep.El SalvadorEquatorial GuineaEritreaEstoniaEthiopiaFaroe IslandsFijiFinlandFranceFrench PolynesiaGabonGambia, TheGeorgiaGermanyGhanaGreeceGreenlandGrenadaGuatemalaGuineaGuinea-BissauGuyanaHaitiHondurasHong Kong SAR, ChinaHungaryIcelandIndiaIndonesiaIran, Islamic Rep.IraqIrelandIsle of ManIsraelItalyJamaicaJapanJordanKazakhstanKenyaKiribatiKorea, Rep.KosovoKuwaitKyrgyz RepublicLao PDRLatviaLebanonLesothoLiberiaLibyaLiechtensteinLithuaniaLuxembourgMacao SAR, ChinaMacedonia, FYRMadagascarMalawiMalaysiaMaldivesMaliMaltaMarshall IslandsMauritaniaMauritiusMexicoMicronesia, Fed. Sts.MoldovaMonacoMongoliaMontenegroMoroccoMozambiqueMyanmarNamibiaNepalNetherlandsNew CaledoniaNew ZealandNicaraguaNigerNigeriaNorwayOmanPakistanPalauPanamaPapua New GuineaParaguayPeruPhilippinesPolandPortugalPuerto RicoQatarRomaniaRussian FederationRwandaSamoaSan MarinoSao Tome and PrincipeSaudi ArabiaSenegalSerbiaSeychellesSierra LeoneSingaporeSlovak RepublicSloveniaSolomon IslandsSomaliaSouth AfricaSouth SudanSpainSri LankaSt. Kitts and NevisSt. LuciaSt. Vincent and the GrenadinesSudanSurinameSwazilandSwedenSwitzerlandSyrian Arab RepublicTajikistanTanzaniaThailandTimor-LesteTogoTongaTrinidad and TobagoTunisiaTurkeyTurkmenistanTuvaluUgandaUkraineUnited Arab EmiratesUnited KingdomUnited StatesUruguayUzbekistanVanuatuVenezuela, RBVietnamVirgin Islands (U.S.)West Bank and GazaYemen, Rep.ZambiaZimbabwe Timeline:
This timeline shows a graph from 1971 to 2015 of Hong Kong SAR, China. No data until 1970. Number of actual observations by date: 45.
Source name:
World Development Indicators
Source organization:
World Bank staff estimates using data from the United Nations Statistics Division's National Accounts Statistics.
Categories, topics:
Economy & Growth, Environment
Last updated:
apr 23, 2017
Indicators value changes by year
Minimum:
269.214 mln
jan 1, 1971
Maximum:
35.358 bln
jan 1, 2015
At the date of observation
Value
Absolute change
Change from previous value
jan 1, 1971
269.214 mln
+269.214 mln
0.0%
jan 1, 1972
304.371 mln
+35.157 mln
13.06%
jan 1, 1973
375.141 mln
+70.77 mln
23.25%
jan 1, 1974
498.177 mln
+123.036 mln
32.8%
jan 1, 1975
614.241 mln
+116.065 mln
23.3%
jan 1, 1976
691.977 mln
+77.736 mln
12.66%
jan 1, 1977
799.417 mln
+107.44 mln
15.53%
jan 1, 1978
922.673 mln
+123.256 mln
15.42%
jan 1, 1979
1.095 bln
+171.862 mln
18.63%
jan 1, 1980
1.342 bln
+247.586 mln
22.62%
jan 1, 1981
1.753 bln
+411.188 mln
30.64%
jan 1, 1982
1.988 bln
+234.273 mln
13.36%
jan 1, 1983
2.31 bln
+322.22 mln
16.21%
jan 1, 1984
2.3 bln
-9.837 mln
-0.43%
jan 1, 1985
2.588 bln
+288.484 mln
12.54%
jan 1, 1986
3.027 bln
+438.926 mln
16.96%
jan 1, 1987
3.381 bln
+353.333 mln
11.67%
jan 1, 1988
3.965 bln
+584.773 mln
17.3%
jan 1, 1989
4.765 bln
+799.474 mln
20.16%
jan 1, 1990
5.905 bln
+1.14 bln
23.92%
jan 1, 1991
6.769 bln
+864.303 mln
14.64%
jan 1, 1992
7.866 bln
+1.097 bln
16.21%
jan 1, 1993
9.259 bln
+1.394 bln
17.72%
jan 1, 1994
10.902 bln
+1.643 bln
17.74%
jan 1, 1995
12.197 bln
+1.295 bln
11.88%
jan 1, 1996
13.678 bln
+1.481 bln
12.15%
jan 1, 1997
15.553 bln
+1.875 bln
13.71%
jan 1, 1998
17.51 bln
+1.957 bln
12.58%
jan 1, 1999
19.759 bln
+2.249 bln
12.84%
jan 1, 2000
20.126 bln
+367.26 mln
1.86%
jan 1, 2001
19.52 bln
-606.358 mln
-3.01%
jan 1, 2002
20.336 bln
+816.489 mln
4.18%
jan 1, 2003
20.928 bln
+592.129 mln
2.91%
jan 1, 2004
20.46 bln
-468.515 mln
-2.24%
jan 1, 2005
20.472 bln
+12.335 mln
0.06%
jan 1, 2006
21.359 bln
+887.292 mln
4.33%
jan 1, 2007
22.007 bln
+647.335 mln
3.03%
jan 1, 2008
23.848 bln
+1.842 bln
8.37%
jan 1, 2009
25.365 bln
+1.516 bln
6.36%
jan 1, 2010
26.498 bln
+1.133 bln
4.47%
jan 1, 2011
27.385 bln
+886.844 mln
3.35%
jan 1, 2012
29.476 bln
+2.091 bln
7.64%
jan 1, 2013
31.408 bln
+1.931 bln
6.55%
jan 1, 2014
33.246 bln
+1.838 bln
5.85%
jan 1, 2015
35.358 bln
+2.112 bln
6.35%
Ranking of countries by current statistics by years


Comments: