29
/
en
AIzaSyAYiBZKx7MnpbEhh9jyipgxe19OcubqV5w
April 1, 2024
83676
Benin
BEN
true
2
1
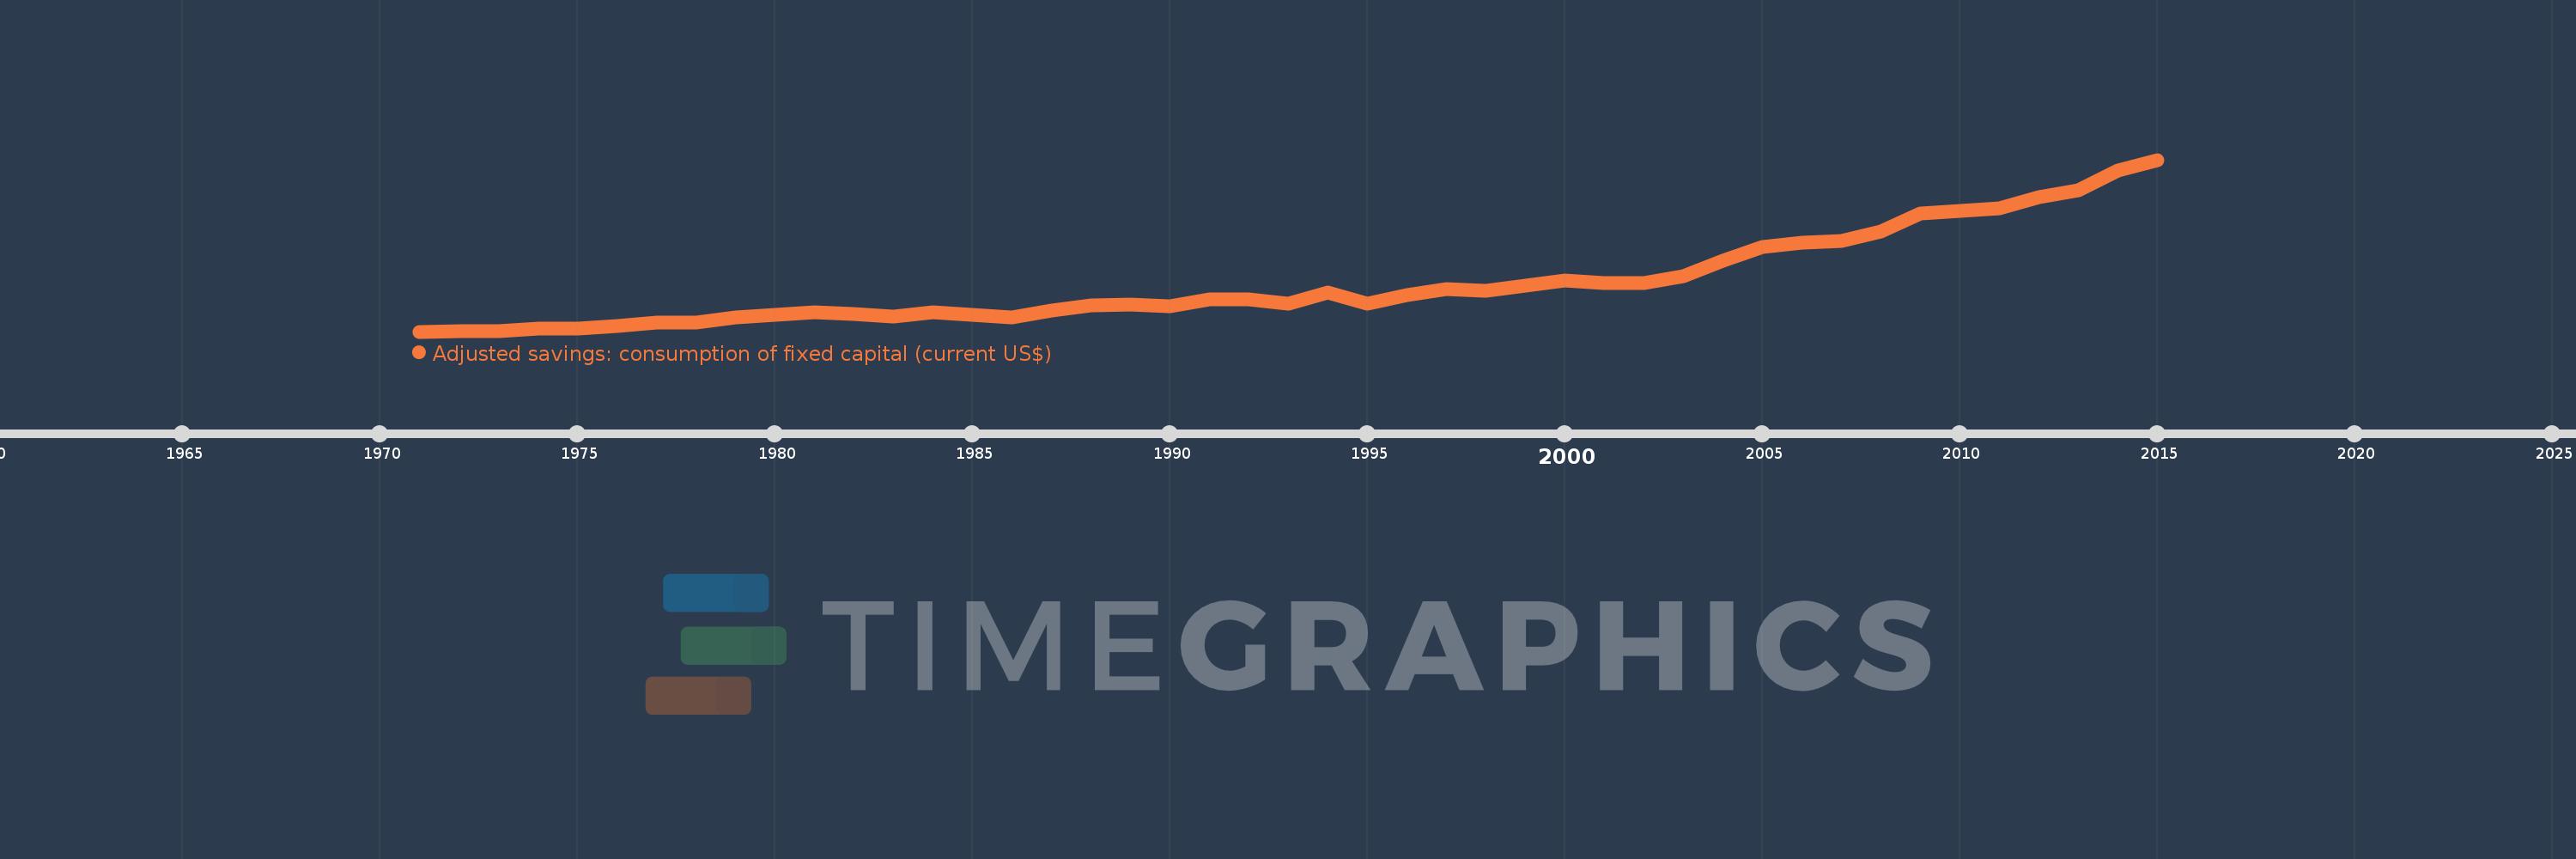
Adjusted savings: consumption of fixed capital (current US$)
2015,2014,2013,2012,2011,2010,2009,2008,2007,2006,2005,2004,2003,2002,2001,2000,1999,1998,1997,1996,1995,1994,1993,1992,1991,1990,1989,1988,1987,1986,1985,1984,1983,1982,1981,1980,1979,1978,1977,1976,1975,1974,1973,1972,1971
This statistics in other country:
AfghanistanAlbaniaAlgeriaAndorraAngolaAntigua and BarbudaArgentinaArmeniaArubaAustraliaAustriaAzerbaijanBahamas, TheBahrainBangladeshBarbadosBelarusBelgiumBelizeBeninBermudaBhutanBoliviaBosnia and HerzegovinaBotswanaBrazilBrunei DarussalamBulgariaBurkina FasoBurundiCabo VerdeCambodiaCameroonCanadaCayman IslandsCentral African RepublicChadChannel IslandsChileChinaColombiaComorosCongo, Dem. Rep.Congo, Rep.Costa RicaCote d'IvoireCroatiaCubaCyprusCzech RepublicDenmarkDjiboutiDominicaDominican RepublicEcuadorEgypt, Arab Rep.El SalvadorEquatorial GuineaEritreaEstoniaEthiopiaFaroe IslandsFijiFinlandFranceFrench PolynesiaGabonGambia, TheGeorgiaGermanyGhanaGreeceGreenlandGrenadaGuatemalaGuineaGuinea-BissauGuyanaHaitiHondurasHong Kong SAR, ChinaHungaryIcelandIndiaIndonesiaIran, Islamic Rep.IraqIrelandIsle of ManIsraelItalyJamaicaJapanJordanKazakhstanKenyaKiribatiKorea, Rep.KosovoKuwaitKyrgyz RepublicLao PDRLatviaLebanonLesothoLiberiaLibyaLiechtensteinLithuaniaLuxembourgMacao SAR, ChinaMacedonia, FYRMadagascarMalawiMalaysiaMaldivesMaliMaltaMarshall IslandsMauritaniaMauritiusMexicoMicronesia, Fed. Sts.MoldovaMonacoMongoliaMontenegroMoroccoMozambiqueMyanmarNamibiaNepalNetherlandsNew CaledoniaNew ZealandNicaraguaNigerNigeriaNorwayOmanPakistanPalauPanamaPapua New GuineaParaguayPeruPhilippinesPolandPortugalPuerto RicoQatarRomaniaRussian FederationRwandaSamoaSan MarinoSao Tome and PrincipeSaudi ArabiaSenegalSerbiaSeychellesSierra LeoneSingaporeSlovak RepublicSloveniaSolomon IslandsSomaliaSouth AfricaSouth SudanSpainSri LankaSt. Kitts and NevisSt. LuciaSt. Vincent and the GrenadinesSudanSurinameSwazilandSwedenSwitzerlandSyrian Arab RepublicTajikistanTanzaniaThailandTimor-LesteTogoTongaTrinidad and TobagoTunisiaTurkeyTurkmenistanTuvaluUgandaUkraineUnited Arab EmiratesUnited KingdomUnited StatesUruguayUzbekistanVanuatuVenezuela, RBVietnamVirgin Islands (U.S.)West Bank and GazaYemen, Rep.ZambiaZimbabwe Timeline:
This timeline shows a graph from 1971 to 2015 of Benin. No data until 1970. Number of actual observations by date: 45.
Source name:
World Development Indicators
Source organization:
World Bank staff estimates using data from the United Nations Statistics Division's National Accounts Statistics.
Categories, topics:
Economy & Growth, Environment
Last updated:
apr 23, 2017
Indicators value changes by year
Minimum:
16.985 mln
jan 1, 1971
Maximum:
537.413 mln
jan 1, 2015
At the date of observation
Value
Absolute change
Change from previous value
jan 1, 1971
16.985 mln
+16.985 mln
0.0%
jan 1, 1972
17.618 mln
+633.459K
3.73%
jan 1, 1973
19.085 mln
+1.466 mln
8.32%
jan 1, 1974
24.932 mln
+5.847 mln
30.64%
jan 1, 1975
25.781 mln
+848.626K
3.4%
jan 1, 1976
33.101 mln
+7.32 mln
28.39%
jan 1, 1977
44.453 mln
+11.352 mln
34.3%
jan 1, 1978
44.322 mln
-130.687K
-0.29%
jan 1, 1979
60.106 mln
+15.783 mln
35.61%
jan 1, 1980
67.482 mln
+7.376 mln
12.27%
jan 1, 1981
75.212 mln
+7.73 mln
11.46%
jan 1, 1982
71.138 mln
-4.073 mln
-5.42%
jan 1, 1983
61.531 mln
-9.607 mln
-13.5%
jan 1, 1984
74.573 mln
+13.042 mln
21.2%
jan 1, 1985
67.858 mln
-6.715 mln
-9.01%
jan 1, 1986
61.21 mln
-6.647 mln
-9.8%
jan 1, 1987
80.681 mln
+19.471 mln
31.81%
jan 1, 1988
95.78 mln
+15.099 mln
18.71%
jan 1, 1989
98.119 mln
+2.339 mln
2.44%
jan 1, 1990
92.849 mln
-5.27 mln
-5.37%
jan 1, 1991
114.357 mln
+21.509 mln
23.17%
jan 1, 1992
115.823 mln
+1.466 mln
1.28%
jan 1, 1993
102.314 mln
-13.509 mln
-11.66%
jan 1, 1994
135.604 mln
+33.29 mln
32.54%
jan 1, 1995
102.006 mln
-33.598 mln
-24.78%
jan 1, 1996
127.757 mln
+25.751 mln
25.24%
jan 1, 1997
146.598 mln
+18.841 mln
14.75%
jan 1, 1998
141.555 mln
-5.043 mln
-3.44%
jan 1, 1999
157.24 mln
+15.685 mln
11.08%
jan 1, 2000
173.091 mln
+15.851 mln
10.08%
jan 1, 2001
165.23 mln
-7.861 mln
-4.54%
jan 1, 2002
164.819 mln
-410.929K
-0.25%
jan 1, 2003
185.144 mln
+20.325 mln
12.33%
jan 1, 2004
232.246 mln
+47.102 mln
25.44%
jan 1, 2005
272.246 mln
+40.0 mln
17.22%
jan 1, 2006
286.595 mln
+14.349 mln
5.27%
jan 1, 2007
292.02 mln
+5.425 mln
1.89%
jan 1, 2008
320.861 mln
+28.841 mln
9.88%
jan 1, 2009
375.764 mln
+54.903 mln
17.11%
jan 1, 2010
381.92 mln
+6.156 mln
1.64%
jan 1, 2011
389.594 mln
+7.674 mln
2.01%
jan 1, 2012
425.109 mln
+35.515 mln
9.12%
jan 1, 2013
446.252 mln
+21.143 mln
4.97%
jan 1, 2014
506.111 mln
+59.859 mln
13.41%
jan 1, 2015
537.413 mln
+31.302 mln
6.18%
Ranking of countries by current statistics by years


Comments: