29
/
en
AIzaSyAYiBZKx7MnpbEhh9jyipgxe19OcubqV5w
April 1, 2024
104512
Chile
CHL
true
2
1
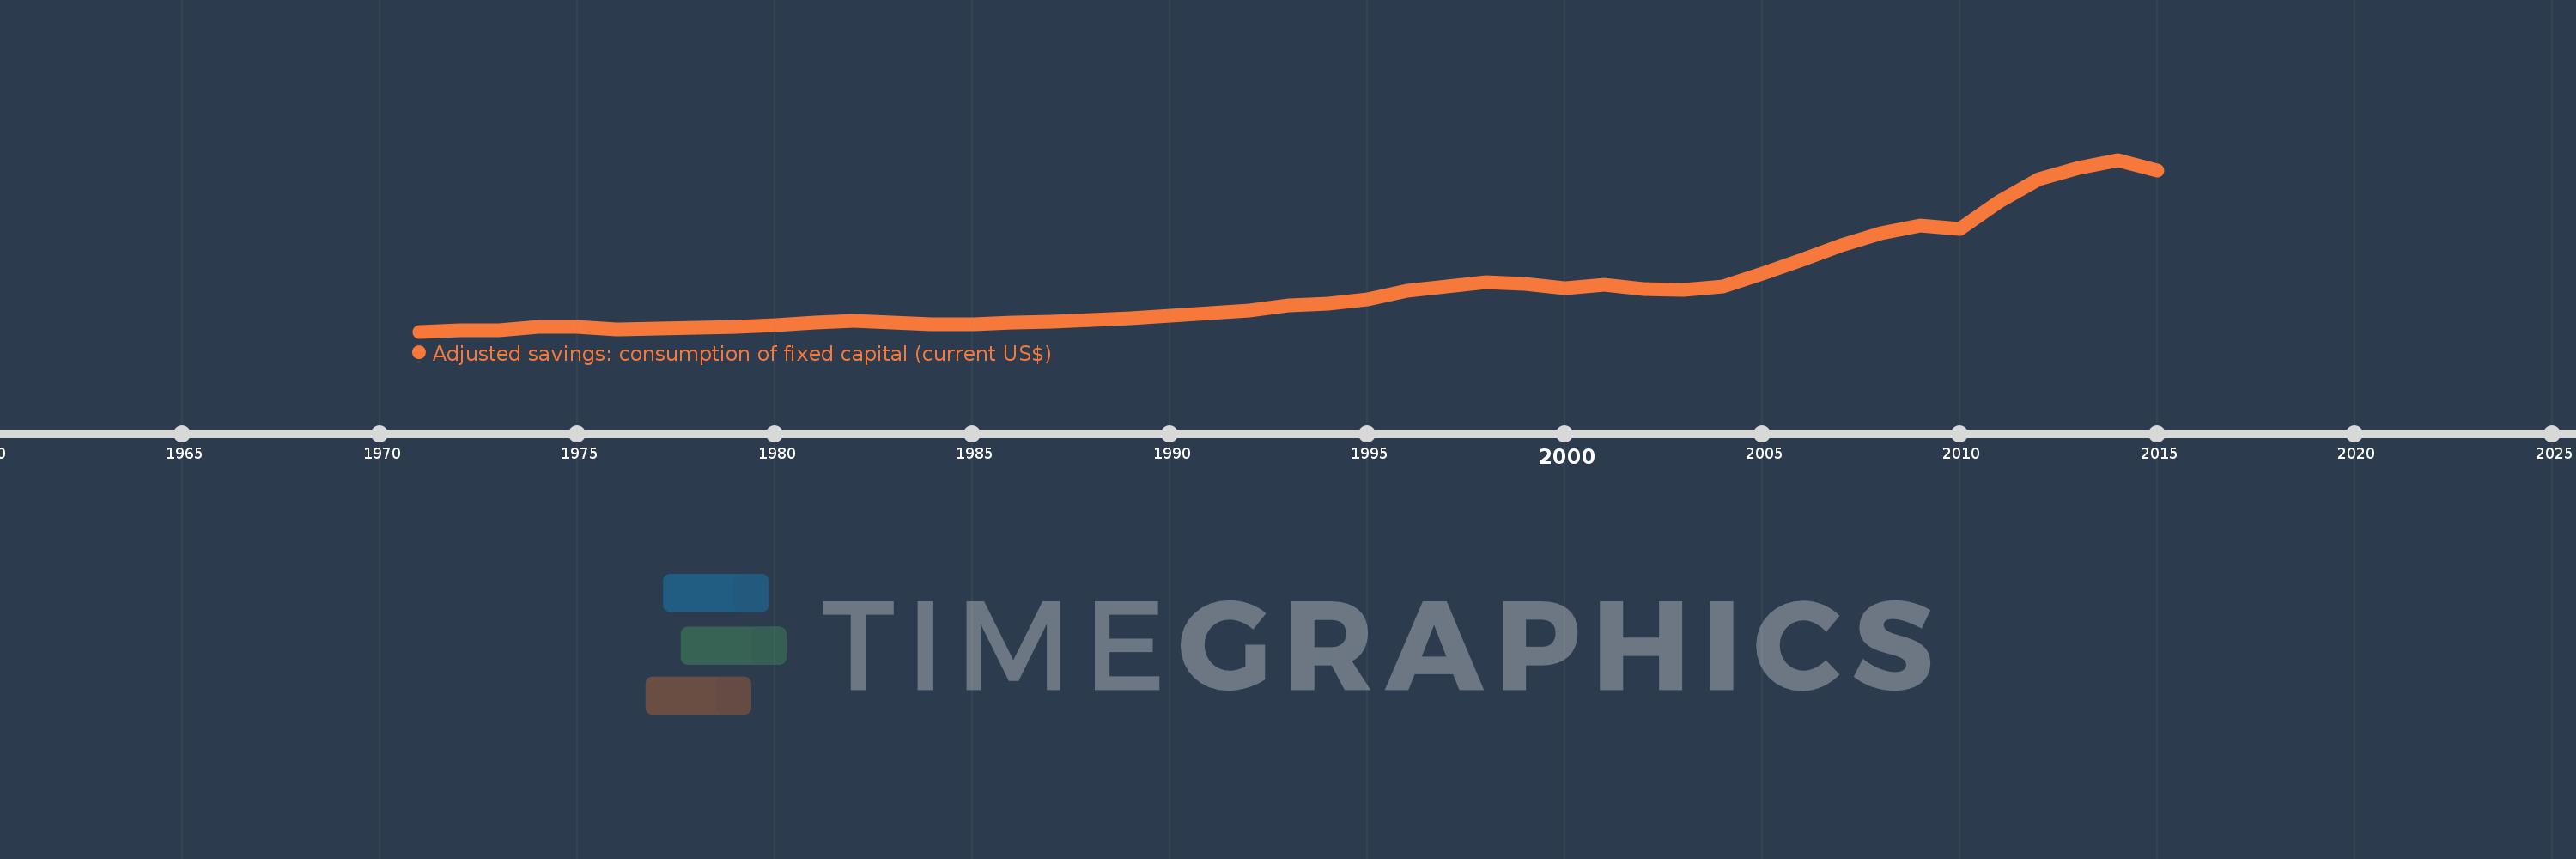
Adjusted savings: consumption of fixed capital (current US$)
2015,2014,2013,2012,2011,2010,2009,2008,2007,2006,2005,2004,2003,2002,2001,2000,1999,1998,1997,1996,1995,1994,1993,1992,1991,1990,1989,1988,1987,1986,1985,1984,1983,1982,1981,1980,1979,1978,1977,1976,1975,1974,1973,1972,1971
This statistics in other country:
AfghanistanAlbaniaAlgeriaAndorraAngolaAntigua and BarbudaArgentinaArmeniaArubaAustraliaAustriaAzerbaijanBahamas, TheBahrainBangladeshBarbadosBelarusBelgiumBelizeBeninBermudaBhutanBoliviaBosnia and HerzegovinaBotswanaBrazilBrunei DarussalamBulgariaBurkina FasoBurundiCabo VerdeCambodiaCameroonCanadaCayman IslandsCentral African RepublicChadChannel IslandsChileChinaColombiaComorosCongo, Dem. Rep.Congo, Rep.Costa RicaCote d'IvoireCroatiaCubaCyprusCzech RepublicDenmarkDjiboutiDominicaDominican RepublicEcuadorEgypt, Arab Rep.El SalvadorEquatorial GuineaEritreaEstoniaEthiopiaFaroe IslandsFijiFinlandFranceFrench PolynesiaGabonGambia, TheGeorgiaGermanyGhanaGreeceGreenlandGrenadaGuatemalaGuineaGuinea-BissauGuyanaHaitiHondurasHong Kong SAR, ChinaHungaryIcelandIndiaIndonesiaIran, Islamic Rep.IraqIrelandIsle of ManIsraelItalyJamaicaJapanJordanKazakhstanKenyaKiribatiKorea, Rep.KosovoKuwaitKyrgyz RepublicLao PDRLatviaLebanonLesothoLiberiaLibyaLiechtensteinLithuaniaLuxembourgMacao SAR, ChinaMacedonia, FYRMadagascarMalawiMalaysiaMaldivesMaliMaltaMarshall IslandsMauritaniaMauritiusMexicoMicronesia, Fed. Sts.MoldovaMonacoMongoliaMontenegroMoroccoMozambiqueMyanmarNamibiaNepalNetherlandsNew CaledoniaNew ZealandNicaraguaNigerNigeriaNorwayOmanPakistanPalauPanamaPapua New GuineaParaguayPeruPhilippinesPolandPortugalPuerto RicoQatarRomaniaRussian FederationRwandaSamoaSan MarinoSao Tome and PrincipeSaudi ArabiaSenegalSerbiaSeychellesSierra LeoneSingaporeSlovak RepublicSloveniaSolomon IslandsSomaliaSouth AfricaSouth SudanSpainSri LankaSt. Kitts and NevisSt. LuciaSt. Vincent and the GrenadinesSudanSurinameSwazilandSwedenSwitzerlandSyrian Arab RepublicTajikistanTanzaniaThailandTimor-LesteTogoTongaTrinidad and TobagoTunisiaTurkeyTurkmenistanTuvaluUgandaUkraineUnited Arab EmiratesUnited KingdomUnited StatesUruguayUzbekistanVanuatuVenezuela, RBVietnamVirgin Islands (U.S.)West Bank and GazaYemen, Rep.ZambiaZimbabwe Timeline:
This timeline shows a graph from 1971 to 2015 of Chile. No data until 1970. Number of actual observations by date: 45.
Source name:
World Development Indicators
Source organization:
World Bank staff estimates using data from the United Nations Statistics Division's National Accounts Statistics.
Categories, topics:
Economy & Growth, Environment
Last updated:
apr 23, 2017
Indicators value changes by year
Minimum:
657.825 mln
jan 1, 1971
Maximum:
34.569 bln
jan 1, 2014
At the date of observation
Value
Absolute change
Change from previous value
jan 1, 1971
657.825 mln
+657.825 mln
0.0%
jan 1, 1972
836.603 mln
+178.778 mln
27.18%
jan 1, 1973
888.959 mln
+52.356 mln
6.26%
jan 1, 1974
1.591 bln
+702.35 mln
79.01%
jan 1, 1975
1.628 bln
+36.462 mln
2.29%
jan 1, 1976
999.498 mln
-628.273 mln
-38.6%
jan 1, 1977
1.22 bln
+220.548 mln
22.07%
jan 1, 1978
1.451 bln
+230.973 mln
18.93%
jan 1, 1979
1.626 bln
+175.388 mln
12.09%
jan 1, 1980
1.888 bln
+261.936 mln
16.11%
jan 1, 1981
2.398 bln
+509.981 mln
27.01%
jan 1, 1982
2.763 bln
+364.606 mln
15.2%
jan 1, 1983
2.433 bln
-330.302 mln
-11.95%
jan 1, 1984
2.158 bln
-274.785 mln
-11.3%
jan 1, 1985
2.126 bln
-31.471 mln
-1.46%
jan 1, 1986
2.418 bln
+291.75 mln
13.72%
jan 1, 1987
2.554 bln
+136.198 mln
5.63%
jan 1, 1988
2.875 bln
+320.953 mln
12.57%
jan 1, 1989
3.235 bln
+360.138 mln
12.53%
jan 1, 1990
3.865 bln
+629.859 mln
19.47%
jan 1, 1991
4.333 bln
+467.847 mln
12.1%
jan 1, 1992
4.87 bln
+536.925 mln
12.39%
jan 1, 1993
5.756 bln
+885.686 mln
18.19%
jan 1, 1994
6.164 bln
+408.5 mln
7.1%
jan 1, 1995
7.002 bln
+837.34 mln
13.58%
jan 1, 1996
8.776 bln
+1.774 bln
25.34%
jan 1, 1997
9.532 bln
+756.442 mln
8.62%
jan 1, 1998
10.434 bln
+901.024 mln
9.45%
jan 1, 1999
10.085 bln
-348.827 mln
-3.34%
jan 1, 2000
9.217 bln
-868.066 mln
-8.61%
jan 1, 2001
9.947 bln
+730.252 mln
7.92%
jan 1, 2002
9.09 bln
-857.162 mln
-8.62%
jan 1, 2003
8.869 bln
-220.557 mln
-2.43%
jan 1, 2004
9.533 bln
+663.612 mln
7.48%
jan 1, 2005
12.049 bln
+2.516 bln
26.39%
jan 1, 2006
14.821 bln
+2.772 bln
23.01%
jan 1, 2007
17.721 bln
+2.9 bln
19.56%
jan 1, 2008
20.049 bln
+2.328 bln
13.14%
jan 1, 2009
21.673 bln
+1.624 bln
8.1%
jan 1, 2010
20.908 bln
-765.215 mln
-3.53%
jan 1, 2011
26.378 bln
+5.47 bln
26.16%
jan 1, 2012
30.8 bln
+4.422 bln
16.76%
jan 1, 2013
33.014 bln
+2.214 bln
7.19%
jan 1, 2014
34.569 bln
+1.555 bln
4.71%
jan 1, 2015
32.403 bln
-2.166 bln
-6.27%
Ranking of countries by current statistics by years


Comments: