29
/
en
AIzaSyAYiBZKx7MnpbEhh9jyipgxe19OcubqV5w
April 1, 2024
169594
Korea, Rep.
KOR
true
2
1
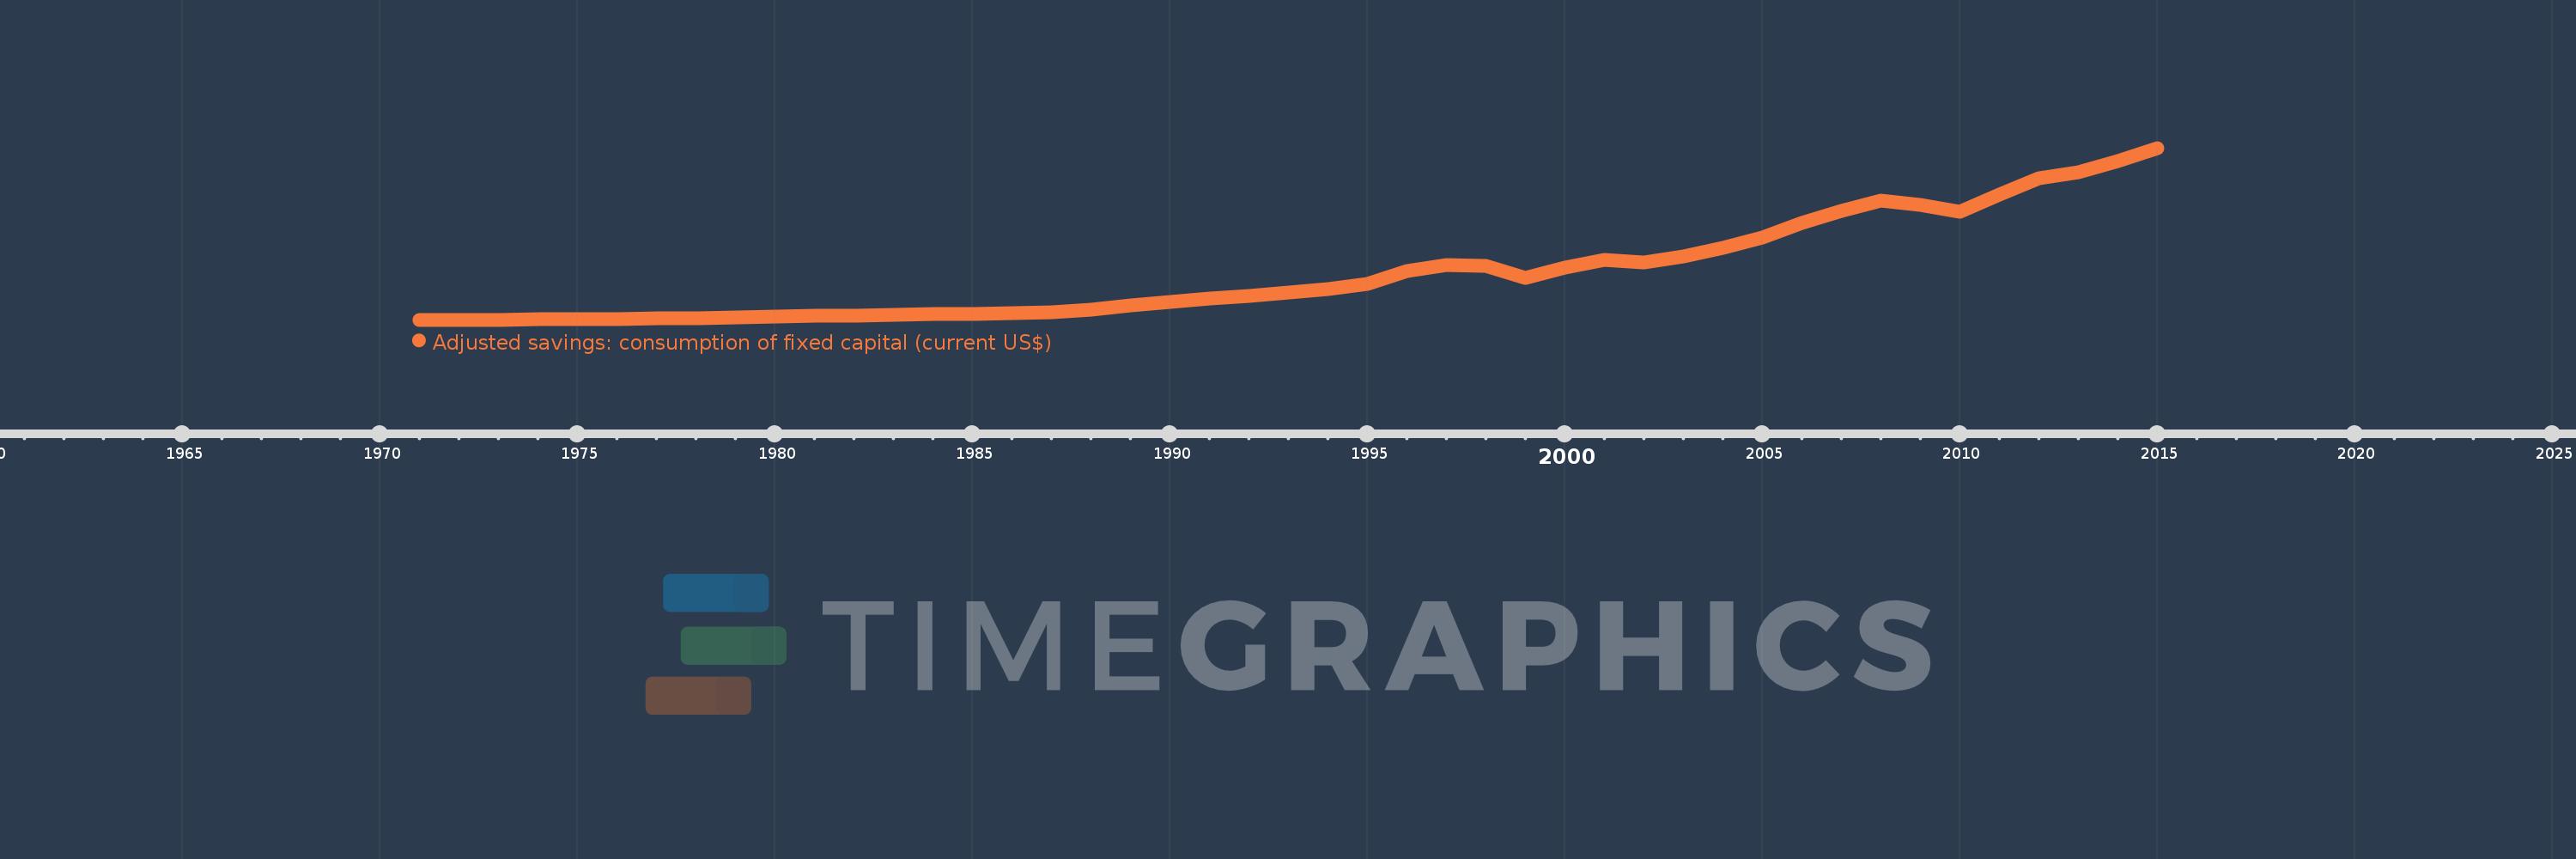
Adjusted savings: consumption of fixed capital (current US$)
2015,2014,2013,2012,2011,2010,2009,2008,2007,2006,2005,2004,2003,2002,2001,2000,1999,1998,1997,1996,1995,1994,1993,1992,1991,1990,1989,1988,1987,1986,1985,1984,1983,1982,1981,1980,1979,1978,1977,1976,1975,1974,1973,1972,1971
This statistics in other country:
AfghanistanAlbaniaAlgeriaAndorraAngolaAntigua and BarbudaArgentinaArmeniaArubaAustraliaAustriaAzerbaijanBahamas, TheBahrainBangladeshBarbadosBelarusBelgiumBelizeBeninBermudaBhutanBoliviaBosnia and HerzegovinaBotswanaBrazilBrunei DarussalamBulgariaBurkina FasoBurundiCabo VerdeCambodiaCameroonCanadaCayman IslandsCentral African RepublicChadChannel IslandsChileChinaColombiaComorosCongo, Dem. Rep.Congo, Rep.Costa RicaCote d'IvoireCroatiaCubaCyprusCzech RepublicDenmarkDjiboutiDominicaDominican RepublicEcuadorEgypt, Arab Rep.El SalvadorEquatorial GuineaEritreaEstoniaEthiopiaFaroe IslandsFijiFinlandFranceFrench PolynesiaGabonGambia, TheGeorgiaGermanyGhanaGreeceGreenlandGrenadaGuatemalaGuineaGuinea-BissauGuyanaHaitiHondurasHong Kong SAR, ChinaHungaryIcelandIndiaIndonesiaIran, Islamic Rep.IraqIrelandIsle of ManIsraelItalyJamaicaJapanJordanKazakhstanKenyaKiribatiKorea, Rep.KosovoKuwaitKyrgyz RepublicLao PDRLatviaLebanonLesothoLiberiaLibyaLiechtensteinLithuaniaLuxembourgMacao SAR, ChinaMacedonia, FYRMadagascarMalawiMalaysiaMaldivesMaliMaltaMarshall IslandsMauritaniaMauritiusMexicoMicronesia, Fed. Sts.MoldovaMonacoMongoliaMontenegroMoroccoMozambiqueMyanmarNamibiaNepalNetherlandsNew CaledoniaNew ZealandNicaraguaNigerNigeriaNorwayOmanPakistanPalauPanamaPapua New GuineaParaguayPeruPhilippinesPolandPortugalPuerto RicoQatarRomaniaRussian FederationRwandaSamoaSan MarinoSao Tome and PrincipeSaudi ArabiaSenegalSerbiaSeychellesSierra LeoneSingaporeSlovak RepublicSloveniaSolomon IslandsSomaliaSouth AfricaSouth SudanSpainSri LankaSt. Kitts and NevisSt. LuciaSt. Vincent and the GrenadinesSudanSurinameSwazilandSwedenSwitzerlandSyrian Arab RepublicTajikistanTanzaniaThailandTimor-LesteTogoTongaTrinidad and TobagoTunisiaTurkeyTurkmenistanTuvaluUgandaUkraineUnited Arab EmiratesUnited KingdomUnited StatesUruguayUzbekistanVanuatuVenezuela, RBVietnamVirgin Islands (U.S.)West Bank and GazaYemen, Rep.ZambiaZimbabwe Timeline:
This timeline shows a graph from 1971 to 2015 of Korea, Rep.. No data until 1970. Number of actual observations by date: 45.
Source name:
World Development Indicators
Source organization:
World Bank staff estimates using data from the United Nations Statistics Division's National Accounts Statistics.
Categories, topics:
Economy & Growth, Environment
Last updated:
apr 23, 2017
Indicators value changes by year
Minimum:
591.899 mln
jan 1, 1971
Maximum:
275.986 bln
jan 1, 2015
At the date of observation
Value
Absolute change
Change from previous value
jan 1, 1971
591.899 mln
+591.899 mln
0.0%
jan 1, 1972
692.467 mln
+100.568 mln
16.99%
jan 1, 1973
775.218 mln
+82.751 mln
11.95%
jan 1, 1974
1.075 bln
+299.828 mln
38.68%
jan 1, 1975
1.498 bln
+423.26 mln
39.37%
jan 1, 1976
1.714 bln
+215.668 mln
14.39%
jan 1, 1977
2.375 bln
+660.914 mln
38.56%
jan 1, 1978
3.16 bln
+784.878 mln
33.05%
jan 1, 1979
4.113 bln
+953.423 mln
30.17%
jan 1, 1980
5.704 bln
+1.591 bln
38.67%
jan 1, 1981
6.426 bln
+721.807 mln
12.65%
jan 1, 1982
7.348 bln
+921.93 mln
14.35%
jan 1, 1983
8.482 bln
+1.135 bln
15.45%
jan 1, 1984
9.529 bln
+1.047 bln
12.34%
jan 1, 1985
10.198 bln
+668.887 mln
7.02%
jan 1, 1986
10.979 bln
+781.018 mln
7.66%
jan 1, 1987
13.016 bln
+2.037 bln
18.55%
jan 1, 1988
17.017 bln
+4.002 bln
30.74%
jan 1, 1989
23.413 bln
+6.396 bln
37.58%
jan 1, 1990
29.159 bln
+5.746 bln
24.54%
jan 1, 1991
34.648 bln
+5.49 bln
18.83%
jan 1, 1992
38.915 bln
+4.267 bln
12.31%
jan 1, 1993
44.737 bln
+5.822 bln
14.96%
jan 1, 1994
50.363 bln
+5.626 bln
12.58%
jan 1, 1995
57.648 bln
+7.285 bln
14.46%
jan 1, 1996
78.695 bln
+21.048 bln
36.51%
jan 1, 1997
88.837 bln
+10.142 bln
12.89%
jan 1, 1998
86.435 bln
-2.402 bln
-2.7%
jan 1, 1999
67.689 bln
-18.746 bln
-21.69%
jan 1, 2000
83.821 bln
+16.131 bln
23.83%
jan 1, 2001
96.075 bln
+12.254 bln
14.62%
jan 1, 2002
92.684 bln
-3.391 bln
-3.53%
jan 1, 2003
102.449 bln
+9.766 bln
10.54%
jan 1, 2004
116.511 bln
+14.062 bln
13.73%
jan 1, 2005
131.696 bln
+15.185 bln
13.03%
jan 1, 2006
155.221 bln
+23.525 bln
17.86%
jan 1, 2007
175.289 bln
+20.068 bln
12.93%
jan 1, 2008
191.573 bln
+16.283 bln
9.29%
jan 1, 2009
184.233 bln
-7.339 bln
-3.83%
jan 1, 2010
173.657 bln
-10.576 bln
-5.74%
jan 1, 2011
200.797 bln
+27.139 bln
15.63%
jan 1, 2012
227.721 bln
+26.924 bln
13.41%
jan 1, 2013
237.37 bln
+9.649 bln
4.24%
jan 1, 2014
254.92 bln
+17.55 bln
7.39%
jan 1, 2015
275.986 bln
+21.066 bln
8.26%
Ranking of countries by current statistics by years


Comments: