29
/
en
AIzaSyAYiBZKx7MnpbEhh9jyipgxe19OcubqV5w
April 1, 2024
208590
New Caledonia
NCL
true
2
1
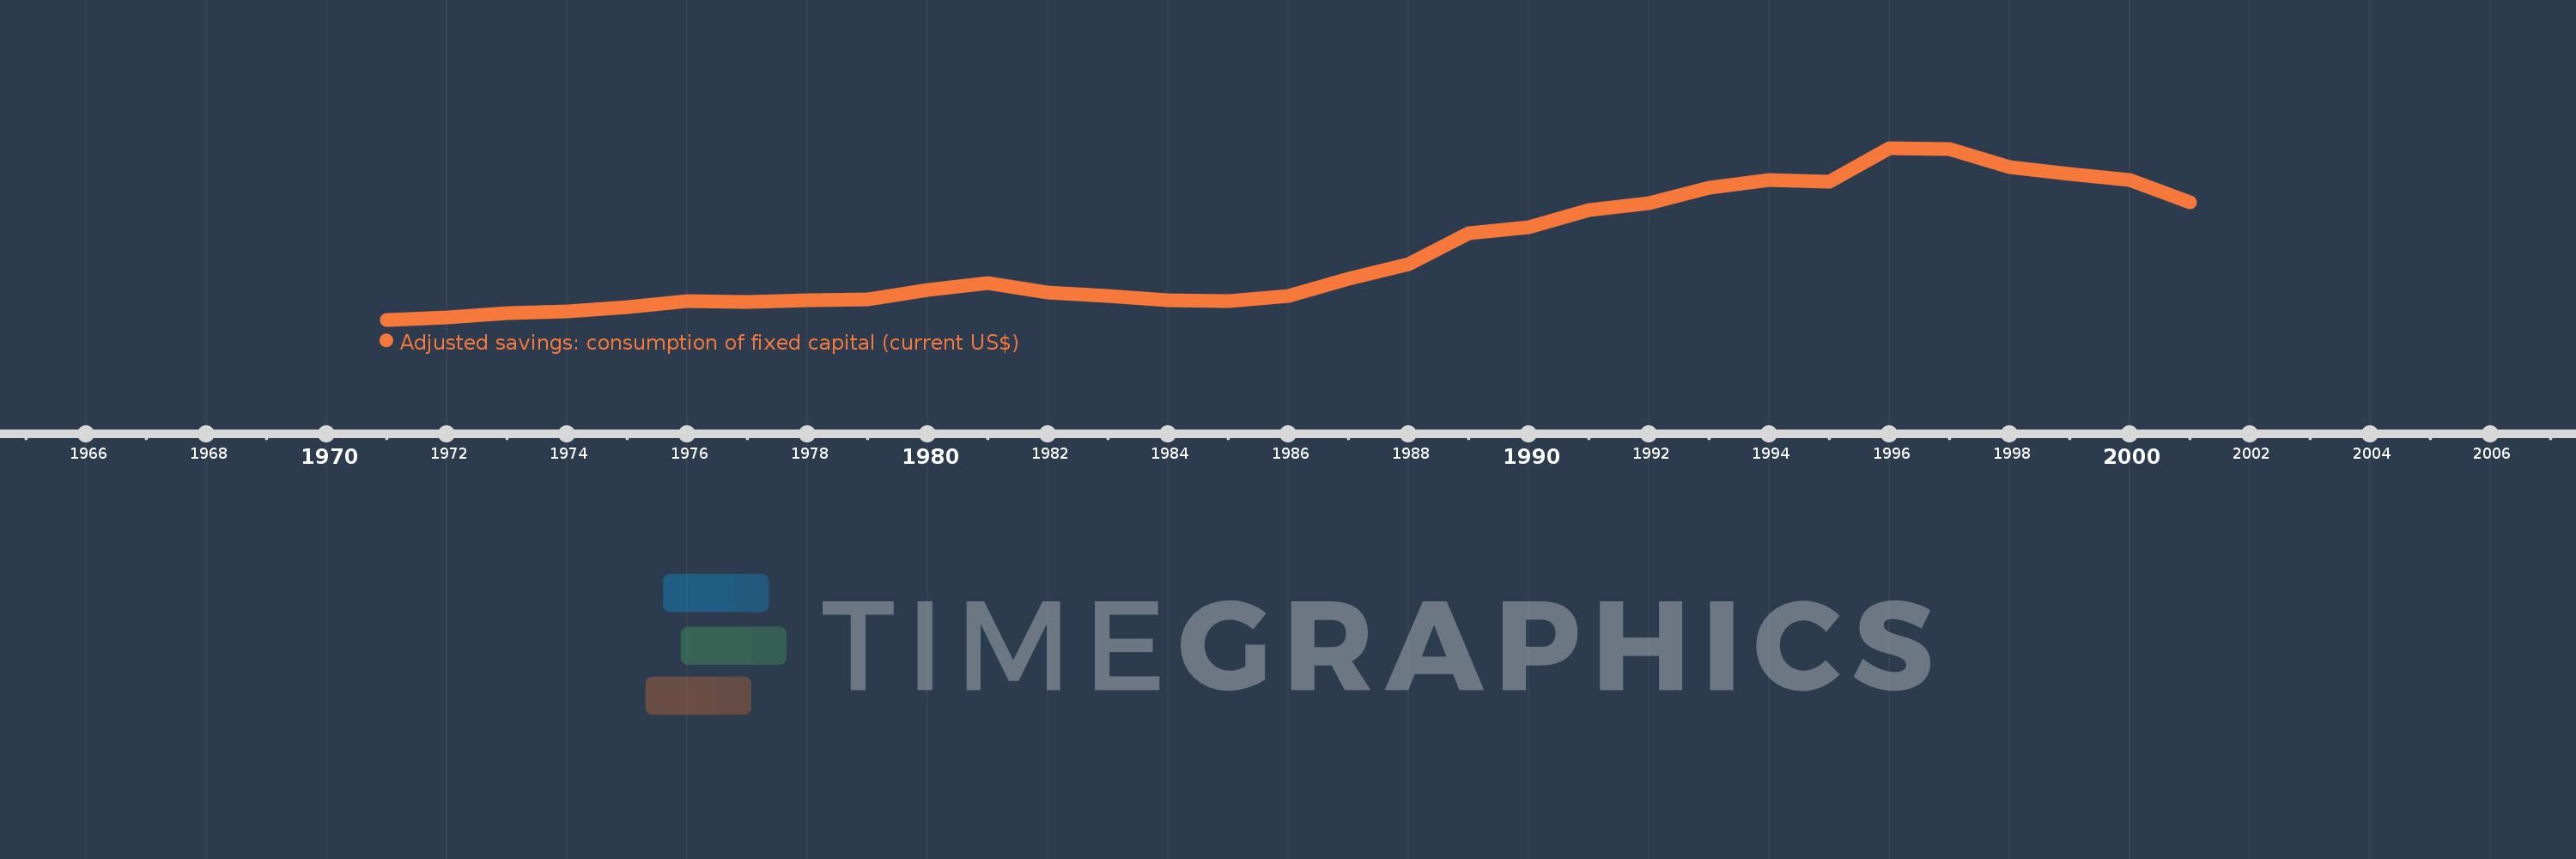
Adjusted savings: consumption of fixed capital (current US$)
2001,2000,1999,1998,1997,1996,1995,1994,1993,1992,1991,1990,1989,1988,1987,1986,1985,1984,1983,1982,1981,1980,1979,1978,1977,1976,1975,1974,1973,1972,1971
This statistics in other country:
AfghanistanAlbaniaAlgeriaAndorraAngolaAntigua and BarbudaArgentinaArmeniaArubaAustraliaAustriaAzerbaijanBahamas, TheBahrainBangladeshBarbadosBelarusBelgiumBelizeBeninBermudaBhutanBoliviaBosnia and HerzegovinaBotswanaBrazilBrunei DarussalamBulgariaBurkina FasoBurundiCabo VerdeCambodiaCameroonCanadaCayman IslandsCentral African RepublicChadChannel IslandsChileChinaColombiaComorosCongo, Dem. Rep.Congo, Rep.Costa RicaCote d'IvoireCroatiaCubaCyprusCzech RepublicDenmarkDjiboutiDominicaDominican RepublicEcuadorEgypt, Arab Rep.El SalvadorEquatorial GuineaEritreaEstoniaEthiopiaFaroe IslandsFijiFinlandFranceFrench PolynesiaGabonGambia, TheGeorgiaGermanyGhanaGreeceGreenlandGrenadaGuatemalaGuineaGuinea-BissauGuyanaHaitiHondurasHong Kong SAR, ChinaHungaryIcelandIndiaIndonesiaIran, Islamic Rep.IraqIrelandIsle of ManIsraelItalyJamaicaJapanJordanKazakhstanKenyaKiribatiKorea, Rep.KosovoKuwaitKyrgyz RepublicLao PDRLatviaLebanonLesothoLiberiaLibyaLiechtensteinLithuaniaLuxembourgMacao SAR, ChinaMacedonia, FYRMadagascarMalawiMalaysiaMaldivesMaliMaltaMarshall IslandsMauritaniaMauritiusMexicoMicronesia, Fed. Sts.MoldovaMonacoMongoliaMontenegroMoroccoMozambiqueMyanmarNamibiaNepalNetherlandsNew CaledoniaNew ZealandNicaraguaNigerNigeriaNorwayOmanPakistanPalauPanamaPapua New GuineaParaguayPeruPhilippinesPolandPortugalPuerto RicoQatarRomaniaRussian FederationRwandaSamoaSan MarinoSao Tome and PrincipeSaudi ArabiaSenegalSerbiaSeychellesSierra LeoneSingaporeSlovak RepublicSloveniaSolomon IslandsSomaliaSouth AfricaSouth SudanSpainSri LankaSt. Kitts and NevisSt. LuciaSt. Vincent and the GrenadinesSudanSurinameSwazilandSwedenSwitzerlandSyrian Arab RepublicTajikistanTanzaniaThailandTimor-LesteTogoTongaTrinidad and TobagoTunisiaTurkeyTurkmenistanTuvaluUgandaUkraineUnited Arab EmiratesUnited KingdomUnited StatesUruguayUzbekistanVanuatuVenezuela, RBVietnamVirgin Islands (U.S.)West Bank and GazaYemen, Rep.ZambiaZimbabwe Timeline:
This timeline shows a graph from 1971 to 2001 of New Caledonia. No data until 1970. Number of actual observations by date: 31.
Source name:
World Development Indicators
Source organization:
World Bank staff estimates using data from the United Nations Statistics Division's National Accounts Statistics.
Categories, topics:
Economy & Growth, Environment
Last updated:
apr 23, 2017
Indicators value changes by year
Minimum:
39.595 mln
jan 1, 1971
Maximum:
530.864 mln
jan 1, 1996
At the date of observation
Value
Absolute change
Change from previous value
jan 1, 1971
39.595 mln
+39.595 mln
0.0%
jan 1, 1972
46.564 mln
+6.969 mln
17.6%
jan 1, 1973
58.544 mln
+11.979 mln
25.73%
jan 1, 1974
63.346 mln
+4.802 mln
8.2%
jan 1, 1975
76.067 mln
+12.721 mln
20.08%
jan 1, 1976
93.726 mln
+17.659 mln
23.22%
jan 1, 1977
91.355 mln
-2.371 mln
-2.53%
jan 1, 1978
96.444 mln
+5.09 mln
5.57%
jan 1, 1979
97.534 mln
+1.09 mln
1.13%
jan 1, 1980
124.017 mln
+26.482 mln
27.15%
jan 1, 1981
144.844 mln
+20.828 mln
16.79%
jan 1, 1982
116.293 mln
-28.551 mln
-19.71%
jan 1, 1983
107.19 mln
-9.103 mln
-7.83%
jan 1, 1984
96.466 mln
-10.724 mln
-10.0%
jan 1, 1985
92.8 mln
-3.665 mln
-3.8%
jan 1, 1986
106.449 mln
+13.648 mln
14.71%
jan 1, 1987
156.011 mln
+49.562 mln
46.56%
jan 1, 1988
198.271 mln
+42.26 mln
27.09%
jan 1, 1989
286.954 mln
+88.683 mln
44.73%
jan 1, 1990
304.318 mln
+17.364 mln
6.05%
jan 1, 1991
354.216 mln
+49.898 mln
16.4%
jan 1, 1992
373.631 mln
+19.415 mln
5.48%
jan 1, 1993
416.05 mln
+42.419 mln
11.35%
jan 1, 1994
439.216 mln
+23.166 mln
5.57%
jan 1, 1995
434.233 mln
-4.983 mln
-1.13%
jan 1, 1996
530.864 mln
+96.631 mln
22.25%
jan 1, 1997
527.388 mln
-3.476 mln
-0.65%
jan 1, 1998
476.554 mln
-50.833 mln
-9.64%
jan 1, 1999
455.314 mln
-21.241 mln
-4.46%
jan 1, 2000
439.075 mln
-16.239 mln
-3.57%
jan 1, 2001
374.449 mln
-64.626 mln
-14.72%
Ranking of countries by current statistics by years


Comments: