29
/
en
AIzaSyAYiBZKx7MnpbEhh9jyipgxe19OcubqV5w
April 1, 2024
221763
Peru
PER
true
2
1
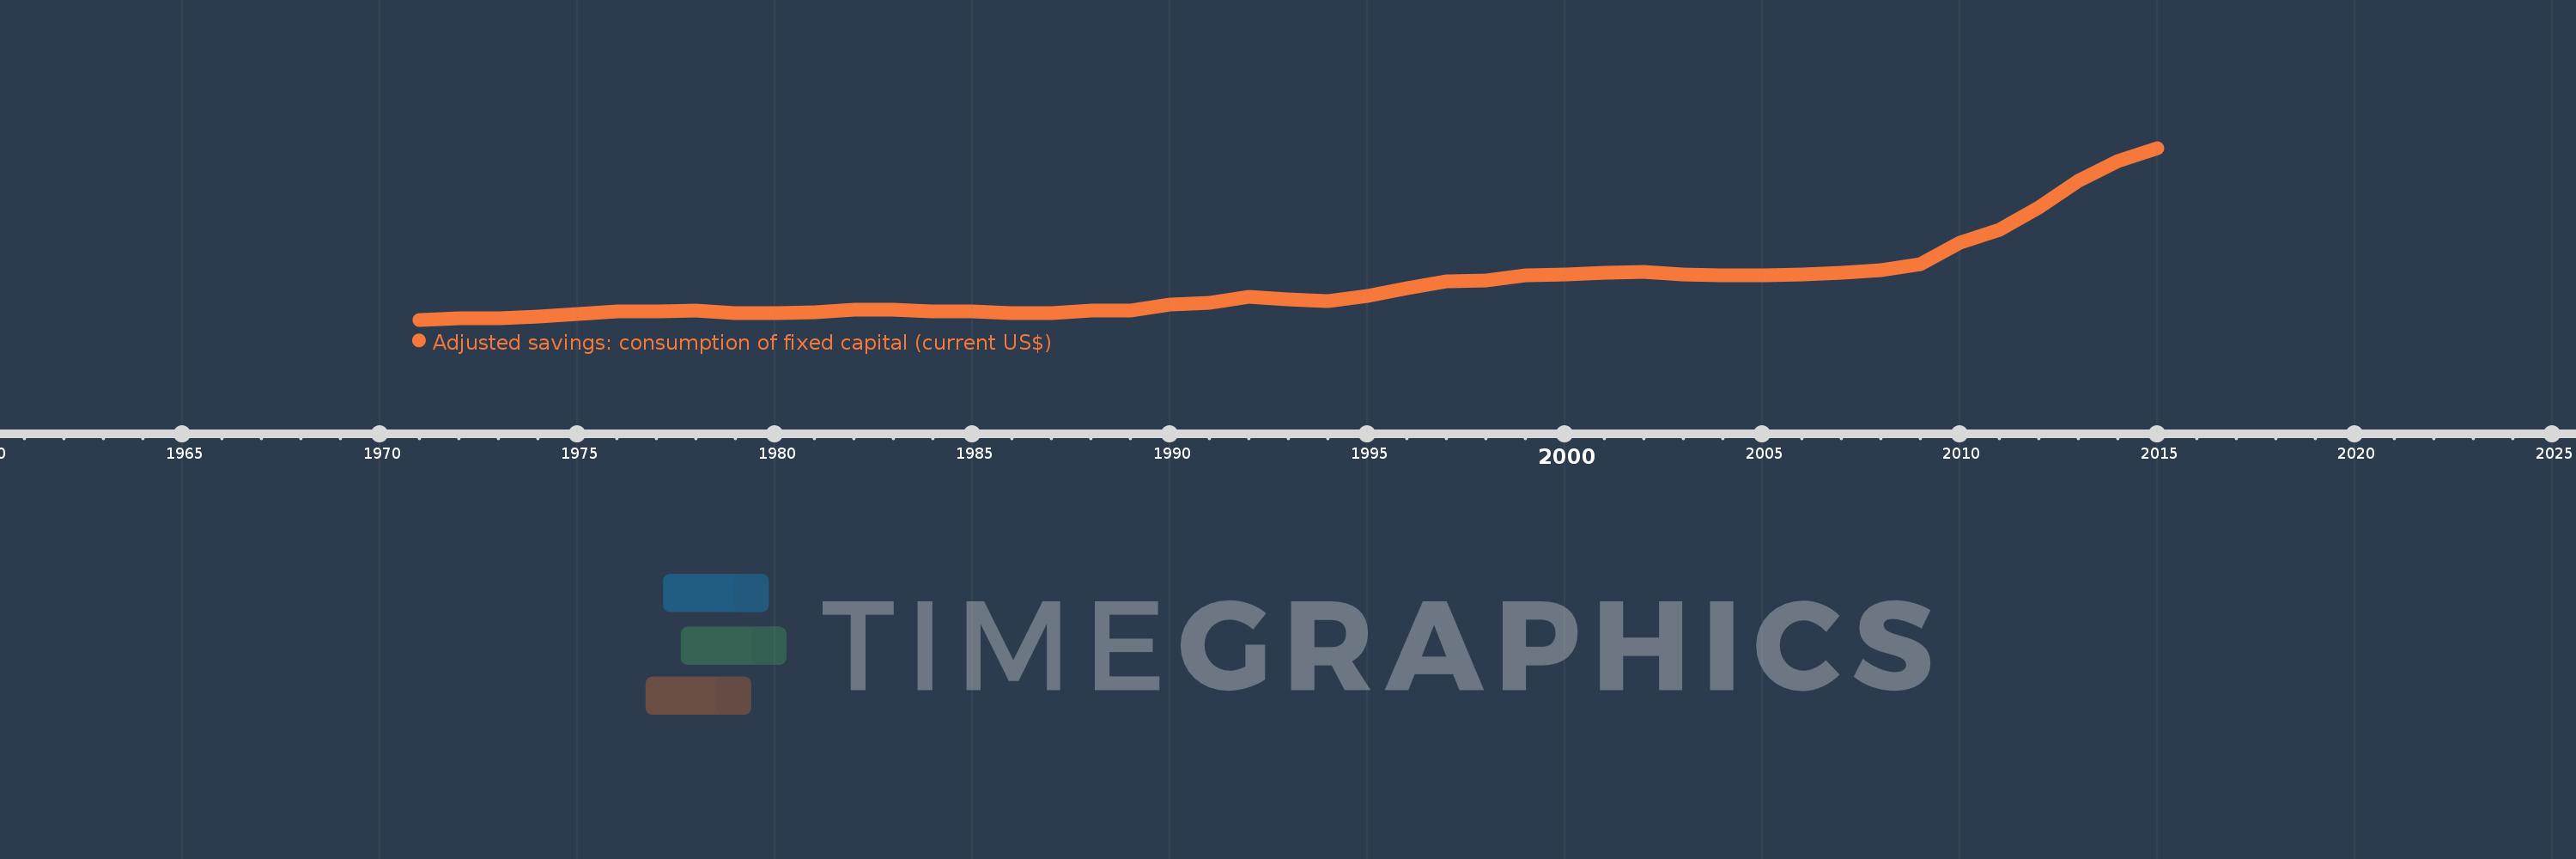
Adjusted savings: consumption of fixed capital (current US$)
2015,2014,2013,2012,2011,2010,2009,2008,2007,2006,2005,2004,2003,2002,2001,2000,1999,1998,1997,1996,1995,1994,1993,1992,1991,1990,1989,1988,1987,1986,1985,1984,1983,1982,1981,1980,1979,1978,1977,1976,1975,1974,1973,1972,1971
This statistics in other country:
AfghanistanAlbaniaAlgeriaAndorraAngolaAntigua and BarbudaArgentinaArmeniaArubaAustraliaAustriaAzerbaijanBahamas, TheBahrainBangladeshBarbadosBelarusBelgiumBelizeBeninBermudaBhutanBoliviaBosnia and HerzegovinaBotswanaBrazilBrunei DarussalamBulgariaBurkina FasoBurundiCabo VerdeCambodiaCameroonCanadaCayman IslandsCentral African RepublicChadChannel IslandsChileChinaColombiaComorosCongo, Dem. Rep.Congo, Rep.Costa RicaCote d'IvoireCroatiaCubaCyprusCzech RepublicDenmarkDjiboutiDominicaDominican RepublicEcuadorEgypt, Arab Rep.El SalvadorEquatorial GuineaEritreaEstoniaEthiopiaFaroe IslandsFijiFinlandFranceFrench PolynesiaGabonGambia, TheGeorgiaGermanyGhanaGreeceGreenlandGrenadaGuatemalaGuineaGuinea-BissauGuyanaHaitiHondurasHong Kong SAR, ChinaHungaryIcelandIndiaIndonesiaIran, Islamic Rep.IraqIrelandIsle of ManIsraelItalyJamaicaJapanJordanKazakhstanKenyaKiribatiKorea, Rep.KosovoKuwaitKyrgyz RepublicLao PDRLatviaLebanonLesothoLiberiaLibyaLiechtensteinLithuaniaLuxembourgMacao SAR, ChinaMacedonia, FYRMadagascarMalawiMalaysiaMaldivesMaliMaltaMarshall IslandsMauritaniaMauritiusMexicoMicronesia, Fed. Sts.MoldovaMonacoMongoliaMontenegroMoroccoMozambiqueMyanmarNamibiaNepalNetherlandsNew CaledoniaNew ZealandNicaraguaNigerNigeriaNorwayOmanPakistanPalauPanamaPapua New GuineaParaguayPeruPhilippinesPolandPortugalPuerto RicoQatarRomaniaRussian FederationRwandaSamoaSan MarinoSao Tome and PrincipeSaudi ArabiaSenegalSerbiaSeychellesSierra LeoneSingaporeSlovak RepublicSloveniaSolomon IslandsSomaliaSouth AfricaSouth SudanSpainSri LankaSt. Kitts and NevisSt. LuciaSt. Vincent and the GrenadinesSudanSurinameSwazilandSwedenSwitzerlandSyrian Arab RepublicTajikistanTanzaniaThailandTimor-LesteTogoTongaTrinidad and TobagoTunisiaTurkeyTurkmenistanTuvaluUgandaUkraineUnited Arab EmiratesUnited KingdomUnited StatesUruguayUzbekistanVanuatuVenezuela, RBVietnamVirgin Islands (U.S.)West Bank and GazaYemen, Rep.ZambiaZimbabwe Timeline:
This timeline shows a graph from 1971 to 2015 of Peru. No data until 1970. Number of actual observations by date: 45.
Source name:
World Development Indicators
Source organization:
World Bank staff estimates using data from the United Nations Statistics Division's National Accounts Statistics.
Categories, topics:
Economy & Growth, Environment
Last updated:
apr 23, 2017
Indicators value changes by year
Minimum:
512.713 mln
jan 1, 1971
Maximum:
15.288 bln
jan 1, 2015
At the date of observation
Value
Absolute change
Change from previous value
jan 1, 1971
512.713 mln
+512.713 mln
0.0%
jan 1, 1972
602.156 mln
+89.444 mln
17.45%
jan 1, 1973
665.697 mln
+63.541 mln
10.55%
jan 1, 1974
793.164 mln
+127.467 mln
19.15%
jan 1, 1975
1.012 bln
+218.981 mln
27.61%
jan 1, 1976
1.237 bln
+225.024 mln
22.23%
jan 1, 1977
1.205 bln
-32.121 mln
-2.6%
jan 1, 1978
1.281 bln
+75.736 mln
6.28%
jan 1, 1979
1.088 bln
-192.631 mln
-15.04%
jan 1, 1980
1.086 bln
-2.006 mln
-0.18%
jan 1, 1981
1.192 bln
+105.751 mln
9.74%
jan 1, 1982
1.383 bln
+190.713 mln
16.0%
jan 1, 1983
1.411 bln
+28.034 mln
2.03%
jan 1, 1984
1.213 bln
-197.493 mln
-14.0%
jan 1, 1985
1.241 bln
+28.239 mln
2.33%
jan 1, 1986
1.117 bln
-124.495 mln
-10.03%
jan 1, 1987
1.059 bln
-58.33 mln
-5.22%
jan 1, 1988
1.335 bln
+276.899 mln
26.16%
jan 1, 1989
1.297 bln
-38.001 mln
-2.85%
jan 1, 1990
1.824 bln
+526.756 mln
40.6%
jan 1, 1991
1.985 bln
+160.52 mln
8.8%
jan 1, 1992
2.469 bln
+484.206 mln
24.4%
jan 1, 1993
2.294 bln
-175.1 mln
-7.09%
jan 1, 1994
2.143 bln
-151.212 mln
-6.59%
jan 1, 1995
2.559 bln
+416.112 mln
19.42%
jan 1, 1996
3.236 bln
+677.094 mln
26.46%
jan 1, 1997
3.851 bln
+615.326 mln
19.02%
jan 1, 1998
3.874 bln
+22.431 mln
0.58%
jan 1, 1999
4.297 bln
+423.112 mln
10.92%
jan 1, 2000
4.403 bln
+106.651 mln
2.48%
jan 1, 2001
4.518 bln
+114.186 mln
2.59%
jan 1, 2002
4.595 bln
+77.688 mln
1.72%
jan 1, 2003
4.442 bln
-153.001 mln
-3.33%
jan 1, 2004
4.326 bln
-116.725 mln
-2.63%
jan 1, 2005
4.361 bln
+35.001 mln
0.81%
jan 1, 2006
4.384 bln
+23.693 mln
0.54%
jan 1, 2007
4.558 bln
+174.124 mln
3.97%
jan 1, 2008
4.751 bln
+192.356 mln
4.22%
jan 1, 2009
5.285 bln
+534.321 mln
11.25%
jan 1, 2010
7.174 bln
+1.889 bln
35.74%
jan 1, 2011
8.268 bln
+1.095 bln
15.26%
jan 1, 2012
10.143 bln
+1.875 bln
22.67%
jan 1, 2013
12.485 bln
+2.342 bln
23.09%
jan 1, 2014
14.156 bln
+1.67 bln
13.38%
jan 1, 2015
15.288 bln
+1.133 bln
8.0%
Ranking of countries by current statistics by years


Comments: