29
/
en
AIzaSyAYiBZKx7MnpbEhh9jyipgxe19OcubqV5w
April 1, 2024
127973
Eritrea
ERI
true
2
1
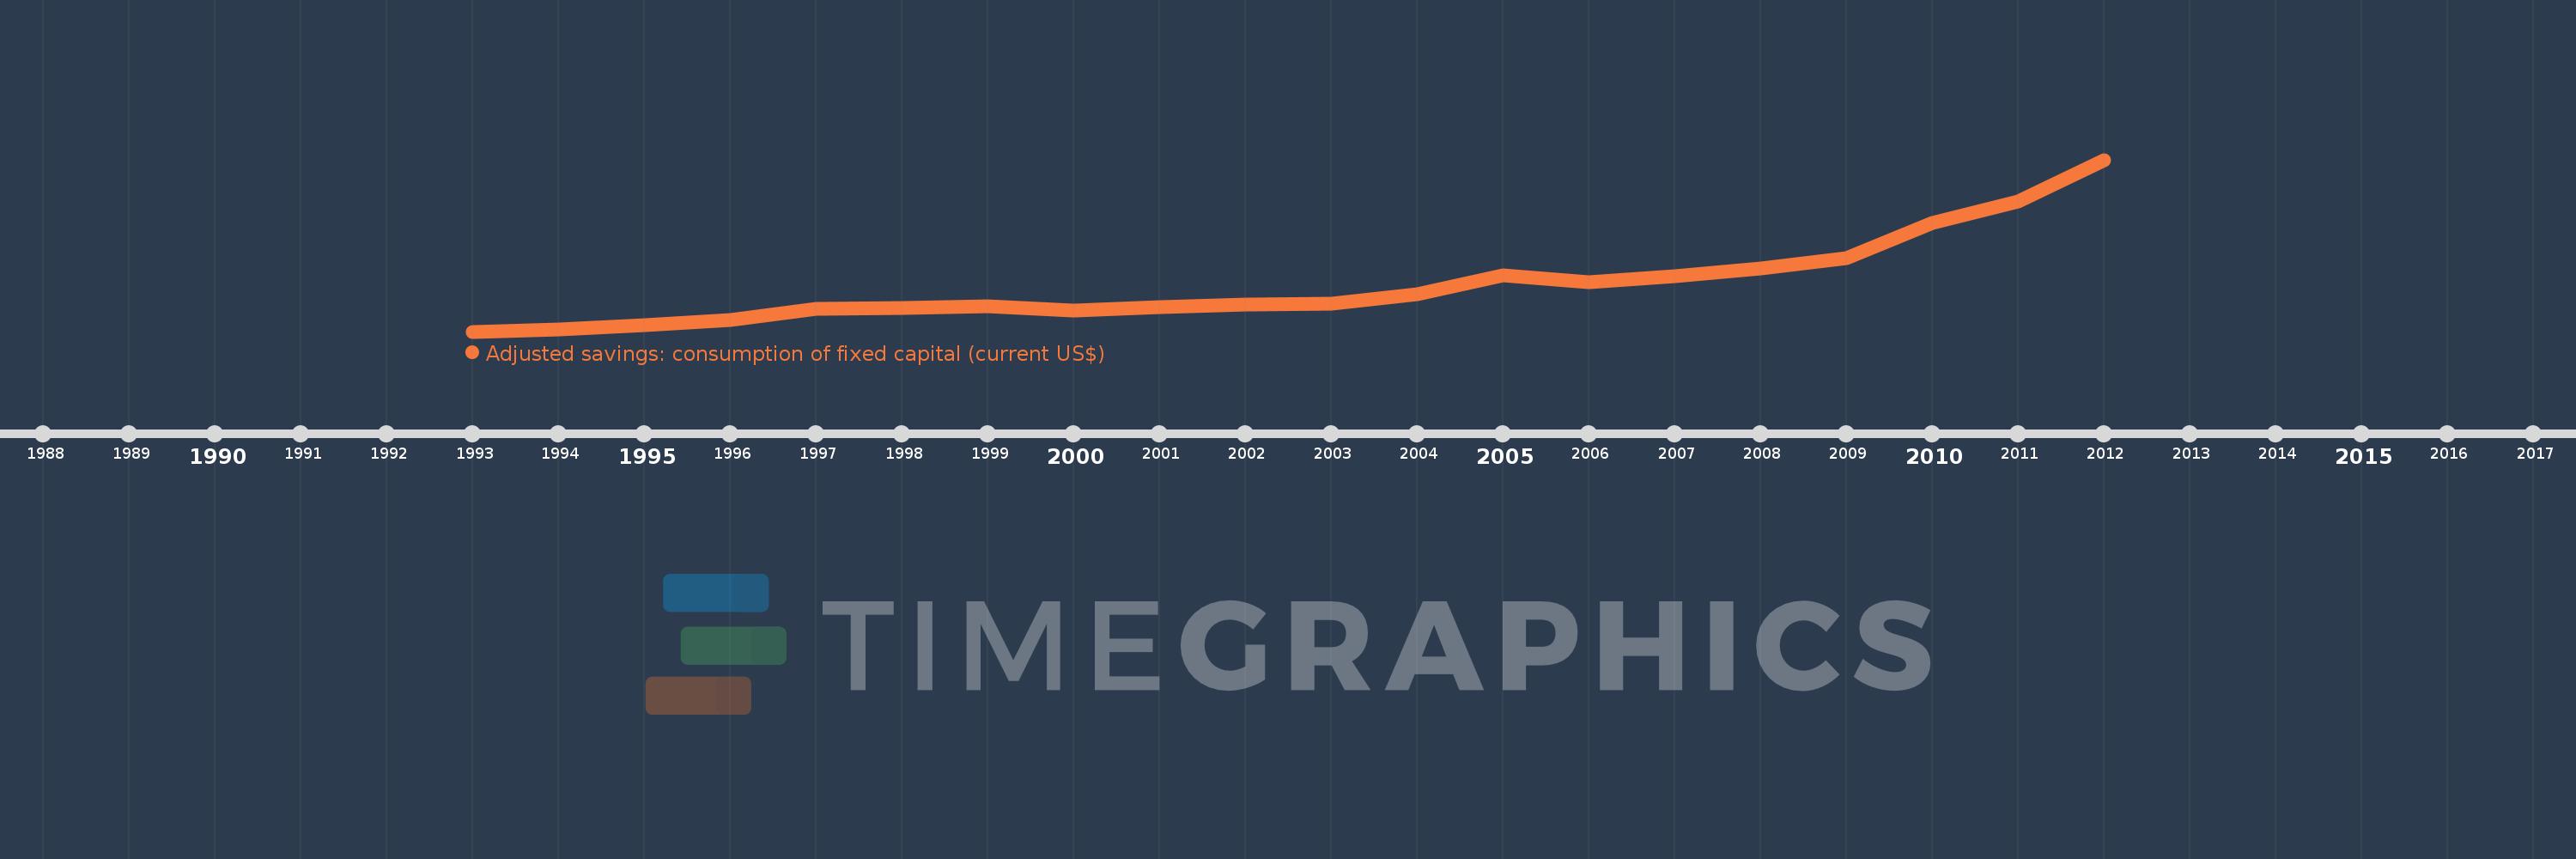
Adjusted savings: consumption of fixed capital (current US$)
2012,2011,2010,2009,2008,2007,2006,2005,2004,2003,2002,2001,2000,1999,1998,1997,1996,1995,1994,1993
This statistics in other country:
AfghanistanAlbaniaAlgeriaAndorraAngolaAntigua and BarbudaArgentinaArmeniaArubaAustraliaAustriaAzerbaijanBahamas, TheBahrainBangladeshBarbadosBelarusBelgiumBelizeBeninBermudaBhutanBoliviaBosnia and HerzegovinaBotswanaBrazilBrunei DarussalamBulgariaBurkina FasoBurundiCabo VerdeCambodiaCameroonCanadaCayman IslandsCentral African RepublicChadChannel IslandsChileChinaColombiaComorosCongo, Dem. Rep.Congo, Rep.Costa RicaCote d'IvoireCroatiaCubaCyprusCzech RepublicDenmarkDjiboutiDominicaDominican RepublicEcuadorEgypt, Arab Rep.El SalvadorEquatorial GuineaEritreaEstoniaEthiopiaFaroe IslandsFijiFinlandFranceFrench PolynesiaGabonGambia, TheGeorgiaGermanyGhanaGreeceGreenlandGrenadaGuatemalaGuineaGuinea-BissauGuyanaHaitiHondurasHong Kong SAR, ChinaHungaryIcelandIndiaIndonesiaIran, Islamic Rep.IraqIrelandIsle of ManIsraelItalyJamaicaJapanJordanKazakhstanKenyaKiribatiKorea, Rep.KosovoKuwaitKyrgyz RepublicLao PDRLatviaLebanonLesothoLiberiaLibyaLiechtensteinLithuaniaLuxembourgMacao SAR, ChinaMacedonia, FYRMadagascarMalawiMalaysiaMaldivesMaliMaltaMarshall IslandsMauritaniaMauritiusMexicoMicronesia, Fed. Sts.MoldovaMonacoMongoliaMontenegroMoroccoMozambiqueMyanmarNamibiaNepalNetherlandsNew CaledoniaNew ZealandNicaraguaNigerNigeriaNorwayOmanPakistanPalauPanamaPapua New GuineaParaguayPeruPhilippinesPolandPortugalPuerto RicoQatarRomaniaRussian FederationRwandaSamoaSan MarinoSao Tome and PrincipeSaudi ArabiaSenegalSerbiaSeychellesSierra LeoneSingaporeSlovak RepublicSloveniaSolomon IslandsSomaliaSouth AfricaSouth SudanSpainSri LankaSt. Kitts and NevisSt. LuciaSt. Vincent and the GrenadinesSudanSurinameSwazilandSwedenSwitzerlandSyrian Arab RepublicTajikistanTanzaniaThailandTimor-LesteTogoTongaTrinidad and TobagoTunisiaTurkeyTurkmenistanTuvaluUgandaUkraineUnited Arab EmiratesUnited KingdomUnited StatesUruguayUzbekistanVanuatuVenezuela, RBVietnamVirgin Islands (U.S.)West Bank and GazaYemen, Rep.ZambiaZimbabwe Timeline:
This timeline shows a graph from 1993 to 2012 of Eritrea. No data until 1992. Number of actual observations by date: 20.
Source name:
World Development Indicators
Source organization:
World Bank staff estimates using data from the United Nations Statistics Division's National Accounts Statistics.
Categories, topics:
Economy & Growth, Environment
Last updated:
apr 23, 2017
Indicators value changes by year
Minimum:
39.346 mln
jan 1, 1993
Maximum:
259.129 mln
jan 1, 2012
At the date of observation
Value
Absolute change
Change from previous value
jan 1, 1993
39.346 mln
+39.346 mln
0.0%
jan 1, 1994
41.765 mln
+2.419 mln
6.15%
jan 1, 1995
47.857 mln
+6.092 mln
14.59%
jan 1, 1996
54.512 mln
+6.656 mln
13.91%
jan 1, 1997
68.193 mln
+13.681 mln
25.1%
jan 1, 1998
69.901 mln
+1.708 mln
2.5%
jan 1, 1999
71.281 mln
+1.379 mln
1.97%
jan 1, 2000
66.105 mln
-5.176 mln
-7.26%
jan 1, 2001
70.246 mln
+4.141 mln
6.26%
jan 1, 2002
74.488 mln
+4.242 mln
6.04%
jan 1, 2003
75.326 mln
+837.713K
1.12%
jan 1, 2004
86.713 mln
+11.387 mln
15.12%
jan 1, 2005
110.867 mln
+24.154 mln
27.86%
jan 1, 2006
102.877 mln
-7.991 mln
-7.21%
jan 1, 2007
110.115 mln
+7.238 mln
7.04%
jan 1, 2008
120.525 mln
+10.41 mln
9.45%
jan 1, 2009
133.584 mln
+13.059 mln
10.83%
jan 1, 2010
177.971 mln
+44.386 mln
33.23%
jan 1, 2011
205.836 mln
+27.866 mln
15.66%
jan 1, 2012
259.129 mln
+53.293 mln
25.89%
Ranking of countries by current statistics by years


Comments: