29
/
en
AIzaSyAYiBZKx7MnpbEhh9jyipgxe19OcubqV5w
April 1, 2024
141497
Greece
GRC
true
2
1
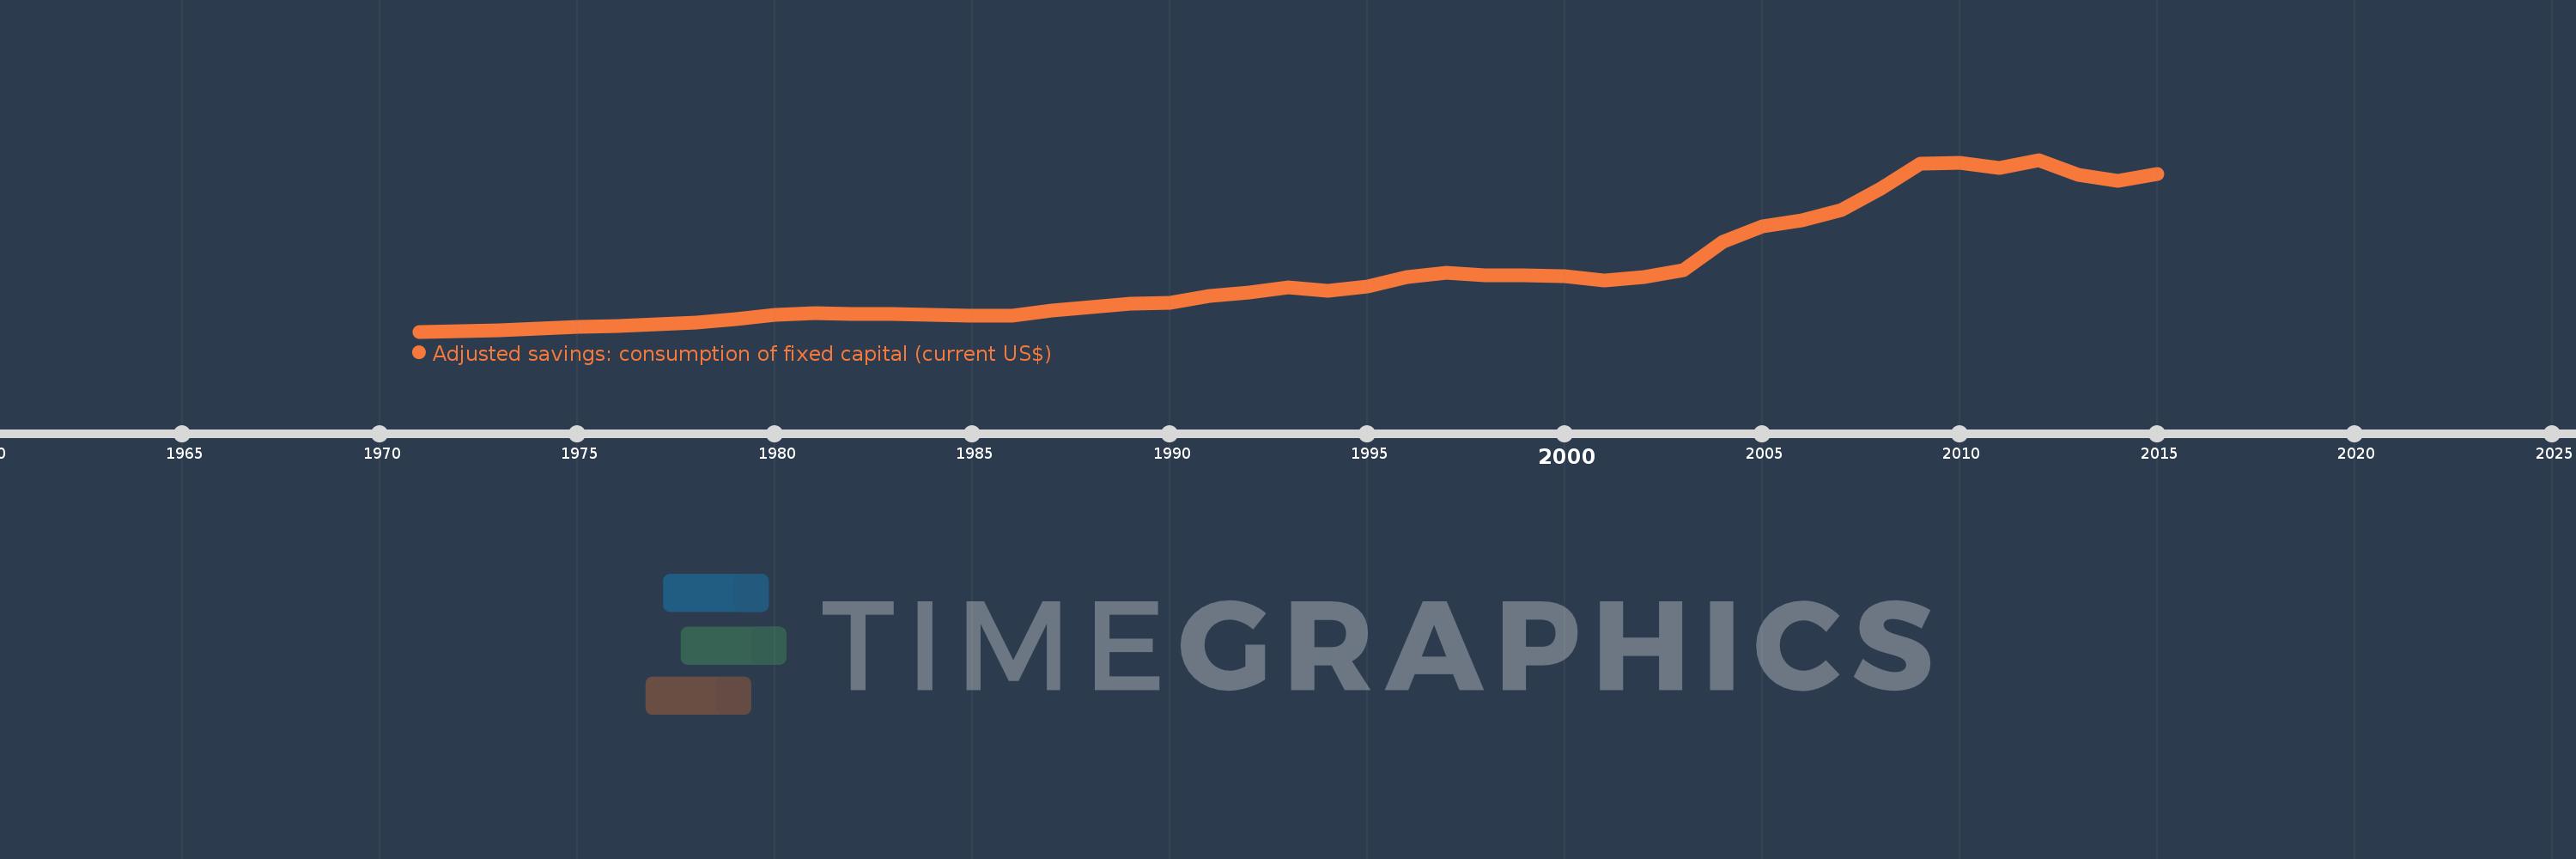
Adjusted savings: consumption of fixed capital (current US$)
2015,2014,2013,2012,2011,2010,2009,2008,2007,2006,2005,2004,2003,2002,2001,2000,1999,1998,1997,1996,1995,1994,1993,1992,1991,1990,1989,1988,1987,1986,1985,1984,1983,1982,1981,1980,1979,1978,1977,1976,1975,1974,1973,1972,1971
This statistics in other country:
AfghanistanAlbaniaAlgeriaAndorraAngolaAntigua and BarbudaArgentinaArmeniaArubaAustraliaAustriaAzerbaijanBahamas, TheBahrainBangladeshBarbadosBelarusBelgiumBelizeBeninBermudaBhutanBoliviaBosnia and HerzegovinaBotswanaBrazilBrunei DarussalamBulgariaBurkina FasoBurundiCabo VerdeCambodiaCameroonCanadaCayman IslandsCentral African RepublicChadChannel IslandsChileChinaColombiaComorosCongo, Dem. Rep.Congo, Rep.Costa RicaCote d'IvoireCroatiaCubaCyprusCzech RepublicDenmarkDjiboutiDominicaDominican RepublicEcuadorEgypt, Arab Rep.El SalvadorEquatorial GuineaEritreaEstoniaEthiopiaFaroe IslandsFijiFinlandFranceFrench PolynesiaGabonGambia, TheGeorgiaGermanyGhanaGreeceGreenlandGrenadaGuatemalaGuineaGuinea-BissauGuyanaHaitiHondurasHong Kong SAR, ChinaHungaryIcelandIndiaIndonesiaIran, Islamic Rep.IraqIrelandIsle of ManIsraelItalyJamaicaJapanJordanKazakhstanKenyaKiribatiKorea, Rep.KosovoKuwaitKyrgyz RepublicLao PDRLatviaLebanonLesothoLiberiaLibyaLiechtensteinLithuaniaLuxembourgMacao SAR, ChinaMacedonia, FYRMadagascarMalawiMalaysiaMaldivesMaliMaltaMarshall IslandsMauritaniaMauritiusMexicoMicronesia, Fed. Sts.MoldovaMonacoMongoliaMontenegroMoroccoMozambiqueMyanmarNamibiaNepalNetherlandsNew CaledoniaNew ZealandNicaraguaNigerNigeriaNorwayOmanPakistanPalauPanamaPapua New GuineaParaguayPeruPhilippinesPolandPortugalPuerto RicoQatarRomaniaRussian FederationRwandaSamoaSan MarinoSao Tome and PrincipeSaudi ArabiaSenegalSerbiaSeychellesSierra LeoneSingaporeSlovak RepublicSloveniaSolomon IslandsSomaliaSouth AfricaSouth SudanSpainSri LankaSt. Kitts and NevisSt. LuciaSt. Vincent and the GrenadinesSudanSurinameSwazilandSwedenSwitzerlandSyrian Arab RepublicTajikistanTanzaniaThailandTimor-LesteTogoTongaTrinidad and TobagoTunisiaTurkeyTurkmenistanTuvaluUgandaUkraineUnited Arab EmiratesUnited KingdomUnited StatesUruguayUzbekistanVanuatuVenezuela, RBVietnamVirgin Islands (U.S.)West Bank and GazaYemen, Rep.ZambiaZimbabwe Timeline:
This timeline shows a graph from 1971 to 2015 of Greece. No data until 1970. Number of actual observations by date: 45.
Source name:
World Development Indicators
Source organization:
World Bank staff estimates using data from the United Nations Statistics Division's National Accounts Statistics.
Categories, topics:
Economy & Growth, Environment
Last updated:
apr 23, 2017
Indicators value changes by year
Minimum:
1.032 bln
jan 1, 1971
Maximum:
52.024 bln
jan 1, 2012
At the date of observation
Value
Absolute change
Change from previous value
jan 1, 1971
1.032 bln
+1.032 bln
0.0%
jan 1, 1972
1.215 bln
+182.969 mln
17.74%
jan 1, 1973
1.477 bln
+262.839 mln
21.64%
jan 1, 1974
1.968 bln
+490.449 mln
33.2%
jan 1, 1975
2.446 bln
+477.864 mln
24.28%
jan 1, 1976
2.788 bln
+341.807 mln
13.98%
jan 1, 1977
3.094 bln
+306.335 mln
10.99%
jan 1, 1978
3.774 bln
+679.878 mln
21.98%
jan 1, 1979
4.726 bln
+952.682 mln
25.25%
jan 1, 1980
5.946 bln
+1.219 bln
25.8%
jan 1, 1981
6.558 bln
+612.247 mln
10.3%
jan 1, 1982
6.229 bln
-328.818 mln
-5.01%
jan 1, 1983
6.345 bln
+115.623 mln
1.86%
jan 1, 1984
6.072 bln
-273.299 mln
-4.31%
jan 1, 1985
5.771 bln
-300.417 mln
-4.95%
jan 1, 1986
5.796 bln
+25.084 mln
0.43%
jan 1, 1987
7.172 bln
+1.375 bln
23.73%
jan 1, 1988
8.404 bln
+1.232 bln
17.18%
jan 1, 1989
9.374 bln
+970.405 mln
11.55%
jan 1, 1990
9.684 bln
+309.855 mln
3.31%
jan 1, 1991
11.707 bln
+2.023 bln
20.89%
jan 1, 1992
12.554 bln
+847.345 mln
7.24%
jan 1, 1993
14.103 bln
+1.549 bln
12.34%
jan 1, 1994
13.208 bln
-895.479 mln
-6.35%
jan 1, 1995
14.292 bln
+1.085 bln
8.21%
jan 1, 1996
17.23 bln
+2.938 bln
20.55%
jan 1, 1997
18.387 bln
+1.157 bln
6.72%
jan 1, 1998
17.626 bln
-761.275 mln
-4.14%
jan 1, 1999
17.834 bln
+207.681 mln
1.18%
jan 1, 2000
17.569 bln
-264.338 mln
-1.48%
jan 1, 2001
16.294 bln
-1.276 bln
-7.26%
jan 1, 2002
17.243 bln
+949.024 mln
5.82%
jan 1, 2003
19.221 bln
+1.978 bln
11.47%
jan 1, 2004
27.584 bln
+8.363 bln
43.51%
jan 1, 2005
32.186 bln
+4.602 bln
16.69%
jan 1, 2006
33.942 bln
+1.756 bln
5.46%
jan 1, 2007
37.002 bln
+3.06 bln
9.02%
jan 1, 2008
43.469 bln
+6.467 bln
17.48%
jan 1, 2009
50.788 bln
+7.319 bln
16.84%
jan 1, 2010
51.008 bln
+219.894 mln
0.43%
jan 1, 2011
49.609 bln
-1.399 bln
-2.74%
jan 1, 2012
52.024 bln
+2.415 bln
4.87%
jan 1, 2013
47.575 bln
-4.449 bln
-8.55%
jan 1, 2014
45.766 bln
-1.808 bln
-3.8%
jan 1, 2015
47.828 bln
+2.061 bln
4.5%
Ranking of countries by current statistics by years


Comments: