29
/
en
AIzaSyAYiBZKx7MnpbEhh9jyipgxe19OcubqV5w
April 1, 2024
171400
Kuwait
KWT
true
2
1
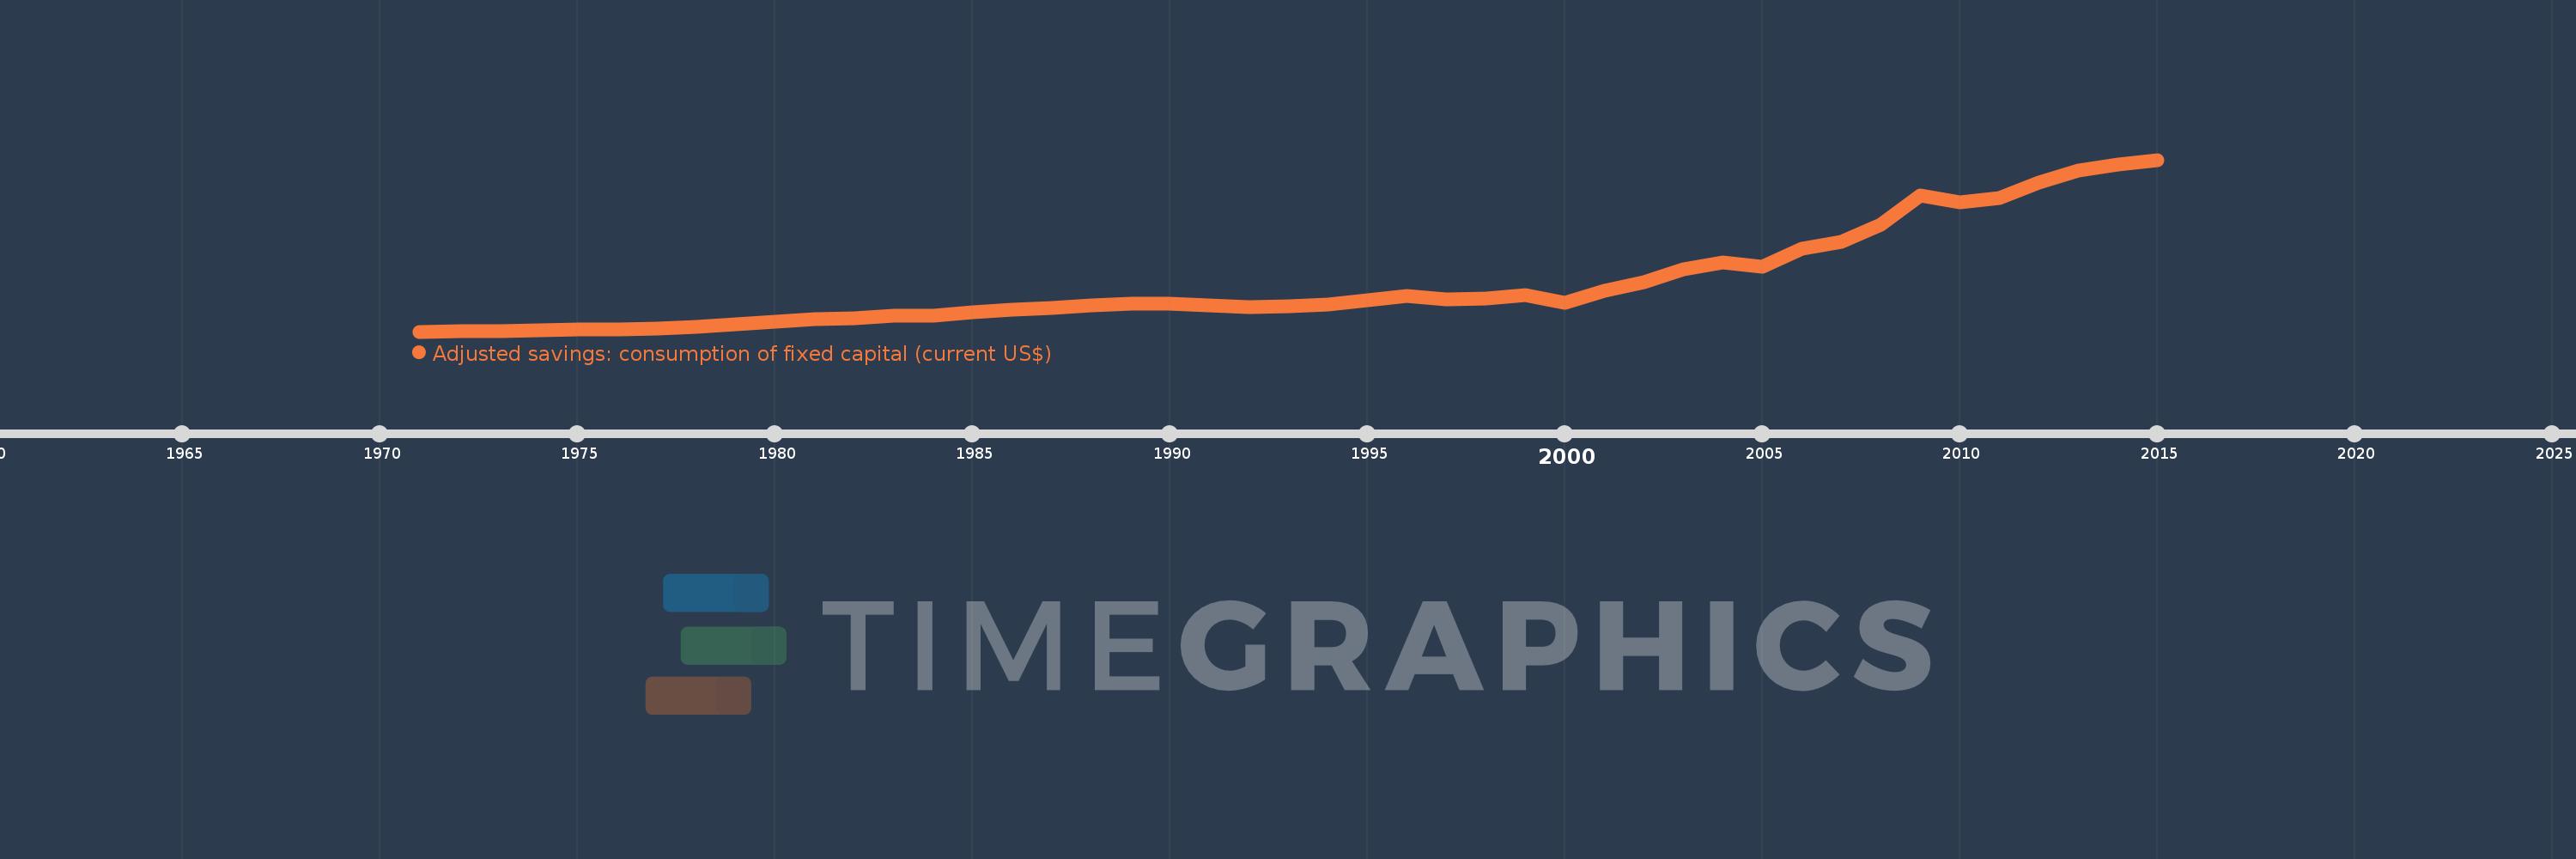
Adjusted savings: consumption of fixed capital (current US$)
2015,2014,2013,2012,2011,2010,2009,2008,2007,2006,2005,2004,2003,2002,2001,2000,1999,1998,1997,1996,1995,1994,1993,1992,1991,1990,1989,1988,1987,1986,1985,1984,1983,1982,1981,1980,1979,1978,1977,1976,1975,1974,1973,1972,1971
This statistics in other country:
AfghanistanAlbaniaAlgeriaAndorraAngolaAntigua and BarbudaArgentinaArmeniaArubaAustraliaAustriaAzerbaijanBahamas, TheBahrainBangladeshBarbadosBelarusBelgiumBelizeBeninBermudaBhutanBoliviaBosnia and HerzegovinaBotswanaBrazilBrunei DarussalamBulgariaBurkina FasoBurundiCabo VerdeCambodiaCameroonCanadaCayman IslandsCentral African RepublicChadChannel IslandsChileChinaColombiaComorosCongo, Dem. Rep.Congo, Rep.Costa RicaCote d'IvoireCroatiaCubaCyprusCzech RepublicDenmarkDjiboutiDominicaDominican RepublicEcuadorEgypt, Arab Rep.El SalvadorEquatorial GuineaEritreaEstoniaEthiopiaFaroe IslandsFijiFinlandFranceFrench PolynesiaGabonGambia, TheGeorgiaGermanyGhanaGreeceGreenlandGrenadaGuatemalaGuineaGuinea-BissauGuyanaHaitiHondurasHong Kong SAR, ChinaHungaryIcelandIndiaIndonesiaIran, Islamic Rep.IraqIrelandIsle of ManIsraelItalyJamaicaJapanJordanKazakhstanKenyaKiribatiKorea, Rep.KosovoKuwaitKyrgyz RepublicLao PDRLatviaLebanonLesothoLiberiaLibyaLiechtensteinLithuaniaLuxembourgMacao SAR, ChinaMacedonia, FYRMadagascarMalawiMalaysiaMaldivesMaliMaltaMarshall IslandsMauritaniaMauritiusMexicoMicronesia, Fed. Sts.MoldovaMonacoMongoliaMontenegroMoroccoMozambiqueMyanmarNamibiaNepalNetherlandsNew CaledoniaNew ZealandNicaraguaNigerNigeriaNorwayOmanPakistanPalauPanamaPapua New GuineaParaguayPeruPhilippinesPolandPortugalPuerto RicoQatarRomaniaRussian FederationRwandaSamoaSan MarinoSao Tome and PrincipeSaudi ArabiaSenegalSerbiaSeychellesSierra LeoneSingaporeSlovak RepublicSloveniaSolomon IslandsSomaliaSouth AfricaSouth SudanSpainSri LankaSt. Kitts and NevisSt. LuciaSt. Vincent and the GrenadinesSudanSurinameSwazilandSwedenSwitzerlandSyrian Arab RepublicTajikistanTanzaniaThailandTimor-LesteTogoTongaTrinidad and TobagoTunisiaTurkeyTurkmenistanTuvaluUgandaUkraineUnited Arab EmiratesUnited KingdomUnited StatesUruguayUzbekistanVanuatuVenezuela, RBVietnamVirgin Islands (U.S.)West Bank and GazaYemen, Rep.ZambiaZimbabwe Timeline:
This timeline shows a graph from 1971 to 2015 of Kuwait. No data until 1970. Number of actual observations by date: 45.
Source name:
World Development Indicators
Source organization:
World Bank staff estimates using data from the United Nations Statistics Division's National Accounts Statistics.
Categories, topics:
Economy & Growth, Environment
Last updated:
apr 23, 2017
Indicators value changes by year
Minimum:
162.447 mln
jan 1, 1971
Maximum:
11.222 bln
jan 1, 2015
At the date of observation
Value
Absolute change
Change from previous value
jan 1, 1971
162.447 mln
+162.447 mln
0.0%
jan 1, 1972
179.7 mln
+17.252 mln
10.62%
jan 1, 1973
212.944 mln
+33.245 mln
18.5%
jan 1, 1974
256.437 mln
+43.493 mln
20.42%
jan 1, 1975
276.381 mln
+19.943 mln
7.78%
jan 1, 1976
320.838 mln
+44.458 mln
16.09%
jan 1, 1977
366.306 mln
+45.468 mln
14.17%
jan 1, 1978
450.08 mln
+83.774 mln
22.87%
jan 1, 1979
614.47 mln
+164.39 mln
36.52%
jan 1, 1980
785.168 mln
+170.697 mln
27.78%
jan 1, 1981
971.247 mln
+186.08 mln
23.7%
jan 1, 1982
1.032 bln
+61.119 mln
6.29%
jan 1, 1983
1.181 bln
+148.231 mln
14.36%
jan 1, 1984
1.191 bln
+9.977 mln
0.85%
jan 1, 1985
1.432 bln
+241.462 mln
20.28%
jan 1, 1986
1.583 bln
+150.643 mln
10.52%
jan 1, 1987
1.672 bln
+89.69 mln
5.67%
jan 1, 1988
1.863 bln
+190.194 mln
11.37%
jan 1, 1989
1.986 bln
+122.962 mln
6.6%
jan 1, 1990
1.95 bln
-35.107 mln
-1.77%
jan 1, 1991
1.843 bln
-106.949 mln
-5.48%
jan 1, 1992
1.747 bln
-95.986 mln
-5.21%
jan 1, 1993
1.813 bln
+65.897 mln
3.77%
jan 1, 1994
1.891 bln
+77.166 mln
4.26%
jan 1, 1995
2.155 bln
+264.337 mln
13.98%
jan 1, 1996
2.44 bln
+284.65 mln
13.21%
jan 1, 1997
2.241 bln
-198.312 mln
-8.13%
jan 1, 1998
2.311 bln
+69.897 mln
3.12%
jan 1, 1999
2.52 bln
+208.599 mln
9.03%
jan 1, 2000
2.017 bln
-502.832 mln
-19.96%
jan 1, 2001
2.774 bln
+756.909 mln
37.53%
jan 1, 2002
3.349 bln
+575.068 mln
20.73%
jan 1, 2003
4.199 bln
+849.888 mln
25.38%
jan 1, 2004
4.631 bln
+432.123 mln
10.29%
jan 1, 2005
4.33 bln
-300.798 mln
-6.5%
jan 1, 2006
5.483 bln
+1.153 bln
26.62%
jan 1, 2007
5.948 bln
+464.766 mln
8.48%
jan 1, 2008
7.044 bln
+1.097 bln
18.44%
jan 1, 2009
8.929 bln
+1.884 bln
26.75%
jan 1, 2010
8.48 bln
-448.525 mln
-5.02%
jan 1, 2011
8.741 bln
+261.416 mln
3.08%
jan 1, 2012
9.776 bln
+1.034 bln
11.83%
jan 1, 2013
10.532 bln
+756.846 mln
7.74%
jan 1, 2014
10.925 bln
+393.073 mln
3.73%
jan 1, 2015
11.222 bln
+296.622 mln
2.71%
Ranking of countries by current statistics by years


Comments: