29
/
en
AIzaSyAYiBZKx7MnpbEhh9jyipgxe19OcubqV5w
April 1, 2024
148779
Haiti
HTI
true
2
1
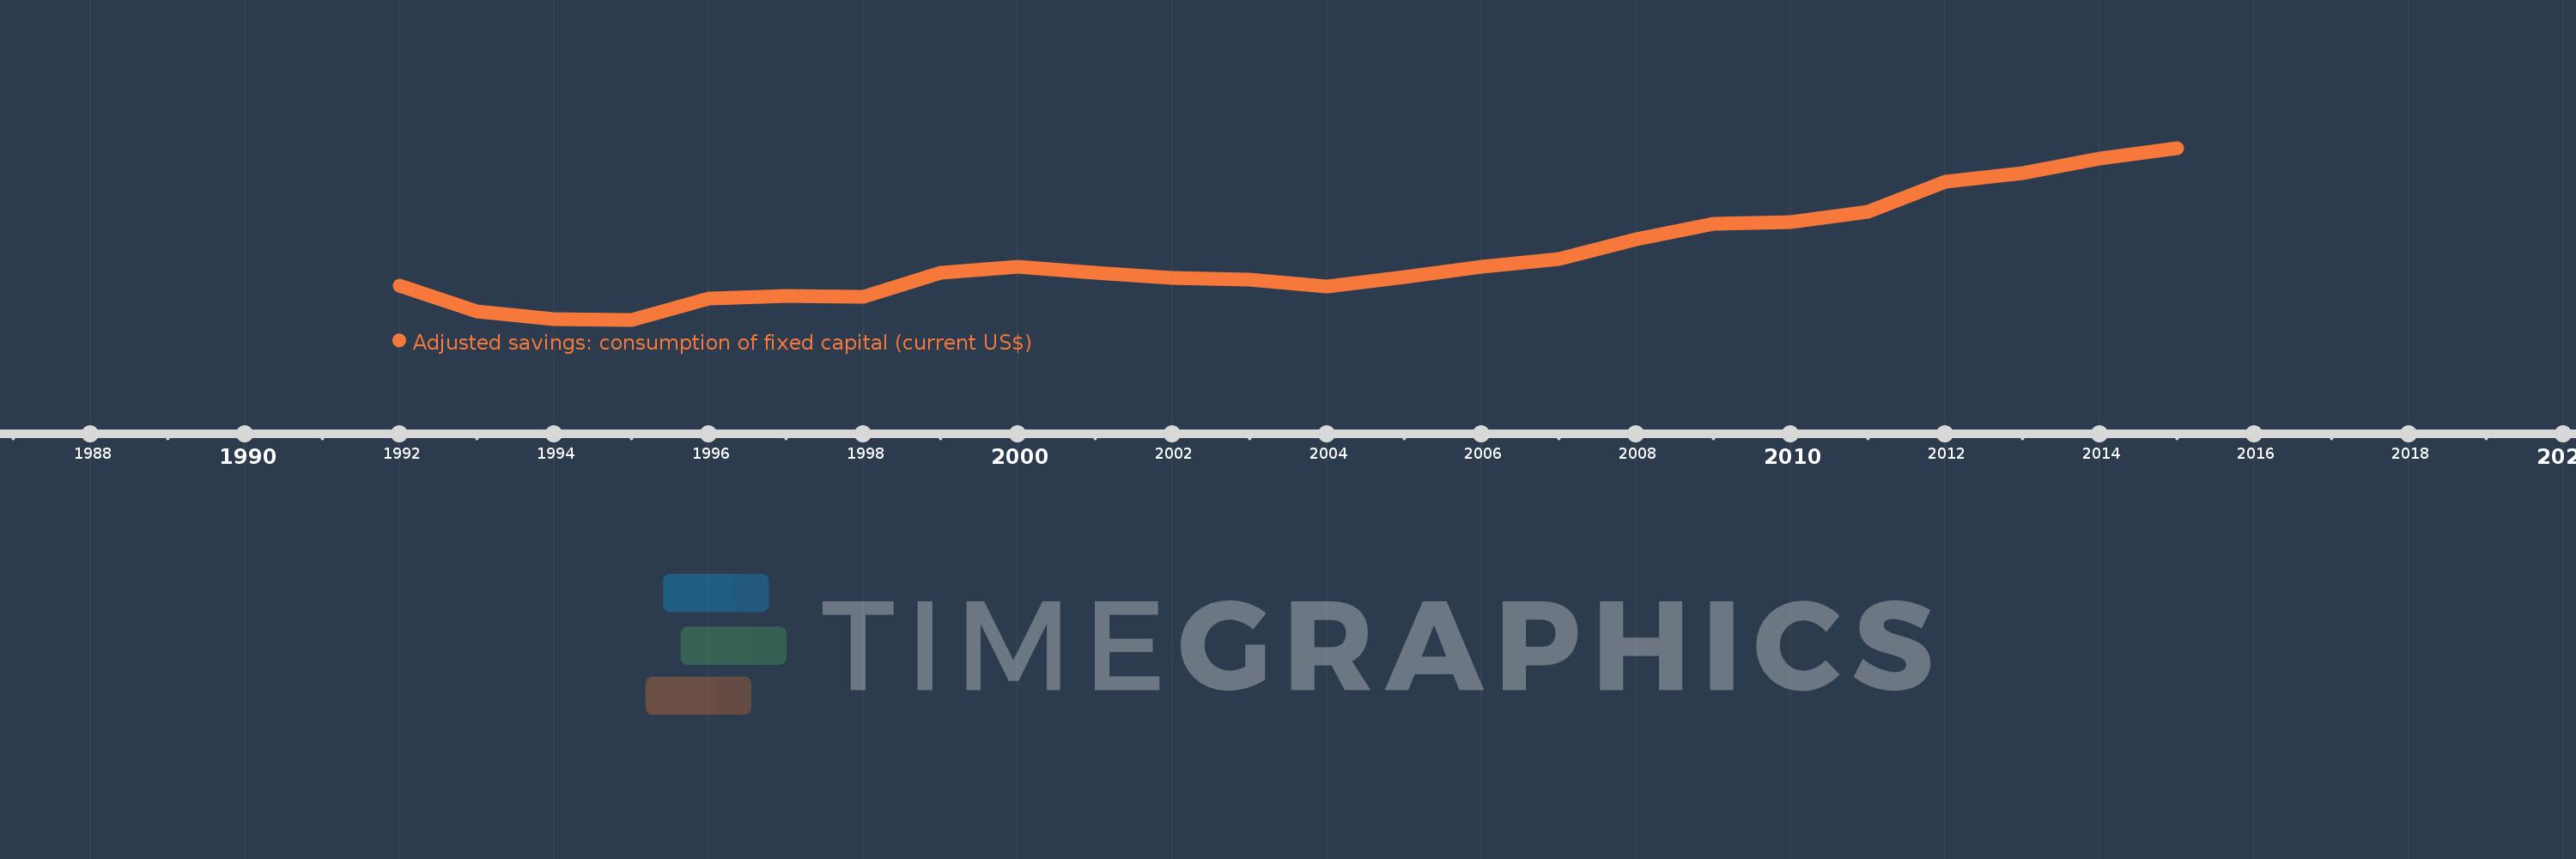
Adjusted savings: consumption of fixed capital (current US$)
2015,2014,2013,2012,2011,2010,2009,2008,2007,2006,2005,2004,2003,2002,2001,2000,1999,1998,1997,1996,1995,1994,1993,1992
This statistics in other country:
AfghanistanAlbaniaAlgeriaAndorraAngolaAntigua and BarbudaArgentinaArmeniaArubaAustraliaAustriaAzerbaijanBahamas, TheBahrainBangladeshBarbadosBelarusBelgiumBelizeBeninBermudaBhutanBoliviaBosnia and HerzegovinaBotswanaBrazilBrunei DarussalamBulgariaBurkina FasoBurundiCabo VerdeCambodiaCameroonCanadaCayman IslandsCentral African RepublicChadChannel IslandsChileChinaColombiaComorosCongo, Dem. Rep.Congo, Rep.Costa RicaCote d'IvoireCroatiaCubaCyprusCzech RepublicDenmarkDjiboutiDominicaDominican RepublicEcuadorEgypt, Arab Rep.El SalvadorEquatorial GuineaEritreaEstoniaEthiopiaFaroe IslandsFijiFinlandFranceFrench PolynesiaGabonGambia, TheGeorgiaGermanyGhanaGreeceGreenlandGrenadaGuatemalaGuineaGuinea-BissauGuyanaHaitiHondurasHong Kong SAR, ChinaHungaryIcelandIndiaIndonesiaIran, Islamic Rep.IraqIrelandIsle of ManIsraelItalyJamaicaJapanJordanKazakhstanKenyaKiribatiKorea, Rep.KosovoKuwaitKyrgyz RepublicLao PDRLatviaLebanonLesothoLiberiaLibyaLiechtensteinLithuaniaLuxembourgMacao SAR, ChinaMacedonia, FYRMadagascarMalawiMalaysiaMaldivesMaliMaltaMarshall IslandsMauritaniaMauritiusMexicoMicronesia, Fed. Sts.MoldovaMonacoMongoliaMontenegroMoroccoMozambiqueMyanmarNamibiaNepalNetherlandsNew CaledoniaNew ZealandNicaraguaNigerNigeriaNorwayOmanPakistanPalauPanamaPapua New GuineaParaguayPeruPhilippinesPolandPortugalPuerto RicoQatarRomaniaRussian FederationRwandaSamoaSan MarinoSao Tome and PrincipeSaudi ArabiaSenegalSerbiaSeychellesSierra LeoneSingaporeSlovak RepublicSloveniaSolomon IslandsSomaliaSouth AfricaSouth SudanSpainSri LankaSt. Kitts and NevisSt. LuciaSt. Vincent and the GrenadinesSudanSurinameSwazilandSwedenSwitzerlandSyrian Arab RepublicTajikistanTanzaniaThailandTimor-LesteTogoTongaTrinidad and TobagoTunisiaTurkeyTurkmenistanTuvaluUgandaUkraineUnited Arab EmiratesUnited KingdomUnited StatesUruguayUzbekistanVanuatuVenezuela, RBVietnamVirgin Islands (U.S.)West Bank and GazaYemen, Rep.ZambiaZimbabwe Timeline:
This timeline shows a graph from 1992 to 2015 of Haiti. No data until 1991. Number of actual observations by date: 24.
Source name:
World Development Indicators
Source organization:
World Bank staff estimates using data from the United Nations Statistics Division's National Accounts Statistics.
Categories, topics:
Economy & Growth, Environment
Last updated:
apr 23, 2017
Indicators value changes by year
Minimum:
23.052 mln
jan 1, 1995
Maximum:
340.891 mln
jan 1, 2015
At the date of observation
Value
Absolute change
Change from previous value
jan 1, 1992
85.921 mln
+85.921 mln
0.0%
jan 1, 1993
38.47 mln
-47.45 mln
-55.23%
jan 1, 1994
24.925 mln
-13.545 mln
-35.21%
jan 1, 1995
23.052 mln
-1.873 mln
-7.52%
jan 1, 1996
61.929 mln
+38.877 mln
168.65%
jan 1, 1997
67.249 mln
+5.321 mln
8.59%
jan 1, 1998
66.083 mln
-1.166 mln
-1.73%
jan 1, 1999
109.353 mln
+43.27 mln
65.48%
jan 1, 2000
120.441 mln
+11.089 mln
10.14%
jan 1, 2001
110.361 mln
-10.08 mln
-8.37%
jan 1, 2002
100.831 mln
-9.53 mln
-8.64%
jan 1, 2003
97.991 mln
-2.841 mln
-2.82%
jan 1, 2004
84.205 mln
-13.785 mln
-14.07%
jan 1, 2005
101.936 mln
+17.731 mln
21.06%
jan 1, 2006
120.66 mln
+18.723 mln
18.37%
jan 1, 2007
136.039 mln
+15.379 mln
12.75%
jan 1, 2008
172.083 mln
+36.044 mln
26.5%
jan 1, 2009
200.939 mln
+28.856 mln
16.77%
jan 1, 2010
203.98 mln
+3.041 mln
1.51%
jan 1, 2011
222.903 mln
+18.923 mln
9.28%
jan 1, 2012
278.697 mln
+55.794 mln
25.03%
jan 1, 2013
295.083 mln
+16.386 mln
5.88%
jan 1, 2014
321.811 mln
+26.727 mln
9.06%
jan 1, 2015
340.891 mln
+19.08 mln
5.93%
Ranking of countries by current statistics by years


Comments: