29
/
en
AIzaSyAYiBZKx7MnpbEhh9jyipgxe19OcubqV5w
April 1, 2024
75903
Bahamas, The
BHS
true
2
1
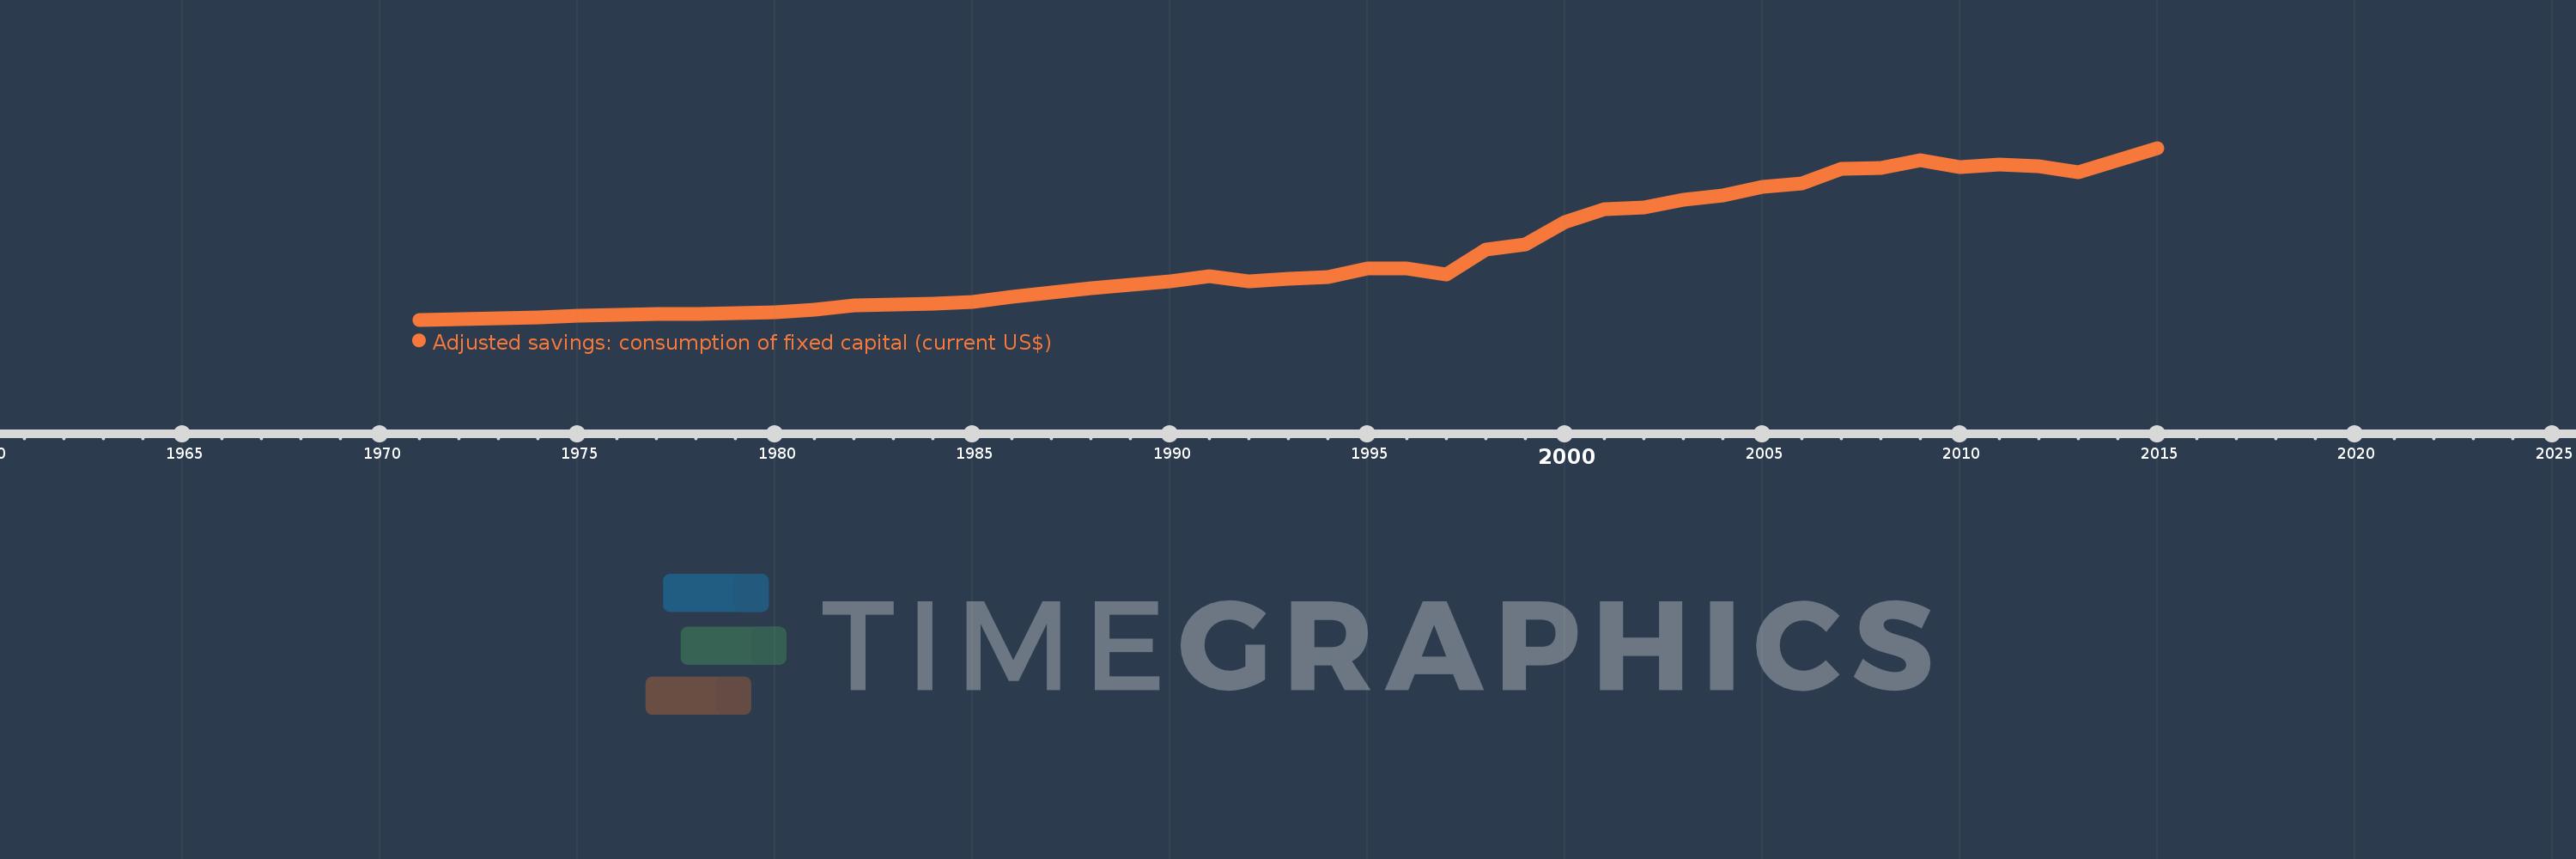
Adjusted savings: consumption of fixed capital (current US$)
2015,2014,2013,2012,2011,2010,2009,2008,2007,2006,2005,2004,2003,2002,2001,2000,1999,1998,1997,1996,1995,1994,1993,1992,1991,1990,1989,1988,1987,1986,1985,1984,1983,1982,1981,1980,1979,1978,1977,1976,1975,1974,1973,1972,1971
This statistics in other country:
AfghanistanAlbaniaAlgeriaAndorraAngolaAntigua and BarbudaArgentinaArmeniaArubaAustraliaAustriaAzerbaijanBahamas, TheBahrainBangladeshBarbadosBelarusBelgiumBelizeBeninBermudaBhutanBoliviaBosnia and HerzegovinaBotswanaBrazilBrunei DarussalamBulgariaBurkina FasoBurundiCabo VerdeCambodiaCameroonCanadaCayman IslandsCentral African RepublicChadChannel IslandsChileChinaColombiaComorosCongo, Dem. Rep.Congo, Rep.Costa RicaCote d'IvoireCroatiaCubaCyprusCzech RepublicDenmarkDjiboutiDominicaDominican RepublicEcuadorEgypt, Arab Rep.El SalvadorEquatorial GuineaEritreaEstoniaEthiopiaFaroe IslandsFijiFinlandFranceFrench PolynesiaGabonGambia, TheGeorgiaGermanyGhanaGreeceGreenlandGrenadaGuatemalaGuineaGuinea-BissauGuyanaHaitiHondurasHong Kong SAR, ChinaHungaryIcelandIndiaIndonesiaIran, Islamic Rep.IraqIrelandIsle of ManIsraelItalyJamaicaJapanJordanKazakhstanKenyaKiribatiKorea, Rep.KosovoKuwaitKyrgyz RepublicLao PDRLatviaLebanonLesothoLiberiaLibyaLiechtensteinLithuaniaLuxembourgMacao SAR, ChinaMacedonia, FYRMadagascarMalawiMalaysiaMaldivesMaliMaltaMarshall IslandsMauritaniaMauritiusMexicoMicronesia, Fed. Sts.MoldovaMonacoMongoliaMontenegroMoroccoMozambiqueMyanmarNamibiaNepalNetherlandsNew CaledoniaNew ZealandNicaraguaNigerNigeriaNorwayOmanPakistanPalauPanamaPapua New GuineaParaguayPeruPhilippinesPolandPortugalPuerto RicoQatarRomaniaRussian FederationRwandaSamoaSan MarinoSao Tome and PrincipeSaudi ArabiaSenegalSerbiaSeychellesSierra LeoneSingaporeSlovak RepublicSloveniaSolomon IslandsSomaliaSouth AfricaSouth SudanSpainSri LankaSt. Kitts and NevisSt. LuciaSt. Vincent and the GrenadinesSudanSurinameSwazilandSwedenSwitzerlandSyrian Arab RepublicTajikistanTanzaniaThailandTimor-LesteTogoTongaTrinidad and TobagoTunisiaTurkeyTurkmenistanTuvaluUgandaUkraineUnited Arab EmiratesUnited KingdomUnited StatesUruguayUzbekistanVanuatuVenezuela, RBVietnamVirgin Islands (U.S.)West Bank and GazaYemen, Rep.ZambiaZimbabwe Timeline:
This timeline shows a graph from 1971 to 2015 of Bahamas, The. No data until 1970. Number of actual observations by date: 45.
Source name:
World Development Indicators
Source organization:
World Bank staff estimates using data from the United Nations Statistics Division's National Accounts Statistics.
Categories, topics:
Economy & Growth, Environment
Last updated:
apr 23, 2017
Indicators value changes by year
Minimum:
22.222 mln
jan 1, 1971
Maximum:
623.381 mln
jan 1, 2015
At the date of observation
Value
Absolute change
Change from previous value
jan 1, 1971
22.222 mln
+22.222 mln
0.0%
jan 1, 1972
23.61 mln
+1.389 mln
6.25%
jan 1, 1973
26.994 mln
+3.383 mln
14.33%
jan 1, 1974
30.27 mln
+3.276 mln
12.14%
jan 1, 1975
35.513 mln
+5.244 mln
17.32%
jan 1, 1976
40.22 mln
+4.706 mln
13.25%
jan 1, 1977
41.12 mln
+900.066K
2.24%
jan 1, 1978
42.472 mln
+1.352 mln
3.29%
jan 1, 1979
44.997 mln
+2.525 mln
5.94%
jan 1, 1980
49.806 mln
+4.809 mln
10.69%
jan 1, 1981
56.443 mln
+6.638 mln
13.33%
jan 1, 1982
73.21 mln
+16.767 mln
29.71%
jan 1, 1983
74.561 mln
+1.351 mln
1.85%
jan 1, 1984
77.106 mln
+2.545 mln
3.41%
jan 1, 1985
83.239 mln
+6.133 mln
7.95%
jan 1, 1986
103.003 mln
+19.764 mln
23.74%
jan 1, 1987
117.851 mln
+14.848 mln
14.41%
jan 1, 1988
133.531 mln
+15.681 mln
13.31%
jan 1, 1989
145.234 mln
+11.702 mln
8.76%
jan 1, 1990
156.213 mln
+10.979 mln
7.56%
jan 1, 1991
173.365 mln
+17.152 mln
10.98%
jan 1, 1992
156.018 mln
-17.347 mln
-10.01%
jan 1, 1993
164.627 mln
+8.609 mln
5.52%
jan 1, 1994
171.593 mln
+6.965 mln
4.23%
jan 1, 1995
202.269 mln
+30.676 mln
17.88%
jan 1, 1996
202.258 mln
-10.9K
-0.01%
jan 1, 1997
180.035 mln
-22.222 mln
-10.99%
jan 1, 1998
267.744 mln
+87.709 mln
48.72%
jan 1, 1999
285.145 mln
+17.401 mln
6.5%
jan 1, 2000
362.976 mln
+77.831 mln
27.3%
jan 1, 2001
410.144 mln
+47.167 mln
12.99%
jan 1, 2002
414.239 mln
+4.095 mln
1.0%
jan 1, 2003
442.082 mln
+27.843 mln
6.72%
jan 1, 2004
456.899 mln
+14.817 mln
3.35%
jan 1, 2005
487.487 mln
+30.587 mln
6.69%
jan 1, 2006
500.521 mln
+13.035 mln
2.67%
jan 1, 2007
549.295 mln
+48.774 mln
9.74%
jan 1, 2008
552.655 mln
+3.36 mln
0.61%
jan 1, 2009
581.737 mln
+29.083 mln
5.26%
jan 1, 2010
556.65 mln
-25.087 mln
-4.31%
jan 1, 2011
565.736 mln
+9.086 mln
1.63%
jan 1, 2012
558.348 mln
-7.388 mln
-1.31%
jan 1, 2013
538.022 mln
-20.326 mln
-3.64%
jan 1, 2014
579.131 mln
+41.109 mln
7.64%
jan 1, 2015
623.381 mln
+44.249 mln
7.64%
Ranking of countries by current statistics by years


Comments: