29
/
en
AIzaSyAYiBZKx7MnpbEhh9jyipgxe19OcubqV5w
April 1, 2024
179716
Libya
LBY
true
2
1
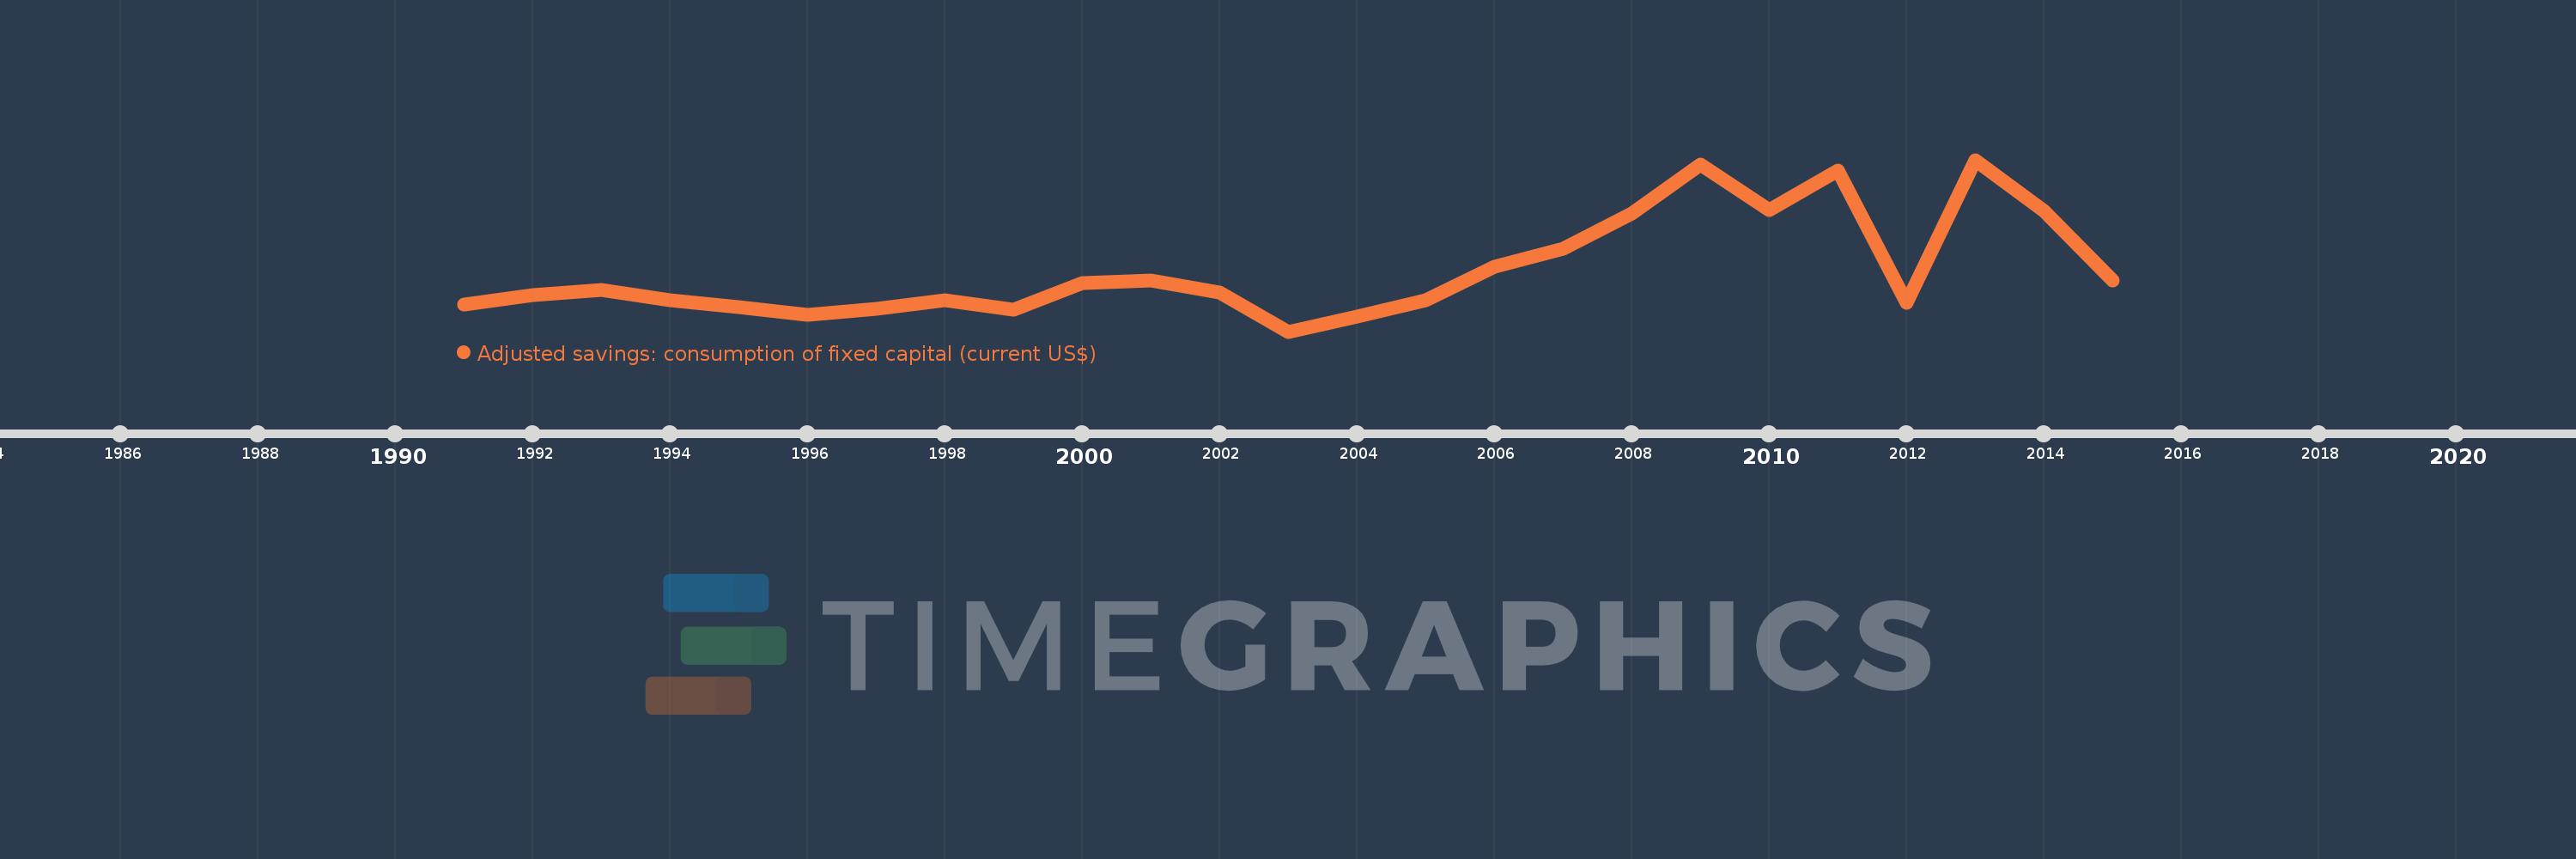
Adjusted savings: consumption of fixed capital (current US$)
2015,2014,2013,2012,2011,2010,2009,2008,2007,2006,2005,2004,2003,2002,2001,2000,1999,1998,1997,1996,1995,1994,1993,1992,1991
This statistics in other country:
AfghanistanAlbaniaAlgeriaAndorraAngolaAntigua and BarbudaArgentinaArmeniaArubaAustraliaAustriaAzerbaijanBahamas, TheBahrainBangladeshBarbadosBelarusBelgiumBelizeBeninBermudaBhutanBoliviaBosnia and HerzegovinaBotswanaBrazilBrunei DarussalamBulgariaBurkina FasoBurundiCabo VerdeCambodiaCameroonCanadaCayman IslandsCentral African RepublicChadChannel IslandsChileChinaColombiaComorosCongo, Dem. Rep.Congo, Rep.Costa RicaCote d'IvoireCroatiaCubaCyprusCzech RepublicDenmarkDjiboutiDominicaDominican RepublicEcuadorEgypt, Arab Rep.El SalvadorEquatorial GuineaEritreaEstoniaEthiopiaFaroe IslandsFijiFinlandFranceFrench PolynesiaGabonGambia, TheGeorgiaGermanyGhanaGreeceGreenlandGrenadaGuatemalaGuineaGuinea-BissauGuyanaHaitiHondurasHong Kong SAR, ChinaHungaryIcelandIndiaIndonesiaIran, Islamic Rep.IraqIrelandIsle of ManIsraelItalyJamaicaJapanJordanKazakhstanKenyaKiribatiKorea, Rep.KosovoKuwaitKyrgyz RepublicLao PDRLatviaLebanonLesothoLiberiaLibyaLiechtensteinLithuaniaLuxembourgMacao SAR, ChinaMacedonia, FYRMadagascarMalawiMalaysiaMaldivesMaliMaltaMarshall IslandsMauritaniaMauritiusMexicoMicronesia, Fed. Sts.MoldovaMonacoMongoliaMontenegroMoroccoMozambiqueMyanmarNamibiaNepalNetherlandsNew CaledoniaNew ZealandNicaraguaNigerNigeriaNorwayOmanPakistanPalauPanamaPapua New GuineaParaguayPeruPhilippinesPolandPortugalPuerto RicoQatarRomaniaRussian FederationRwandaSamoaSan MarinoSao Tome and PrincipeSaudi ArabiaSenegalSerbiaSeychellesSierra LeoneSingaporeSlovak RepublicSloveniaSolomon IslandsSomaliaSouth AfricaSouth SudanSpainSri LankaSt. Kitts and NevisSt. LuciaSt. Vincent and the GrenadinesSudanSurinameSwazilandSwedenSwitzerlandSyrian Arab RepublicTajikistanTanzaniaThailandTimor-LesteTogoTongaTrinidad and TobagoTunisiaTurkeyTurkmenistanTuvaluUgandaUkraineUnited Arab EmiratesUnited KingdomUnited StatesUruguayUzbekistanVanuatuVenezuela, RBVietnamVirgin Islands (U.S.)West Bank and GazaYemen, Rep.ZambiaZimbabwe Timeline:
This timeline shows a graph from 1991 to 2015 of Libya. No data until 1990. Number of actual observations by date: 25.
Source name:
World Development Indicators
Source organization:
World Bank staff estimates using data from the United Nations Statistics Division's National Accounts Statistics.
Categories, topics:
Economy & Growth, Environment
Last updated:
apr 23, 2017
Indicators value changes by year
Minimum:
1.791 bln
jan 1, 2003
Maximum:
7.512 bln
jan 1, 2013
At the date of observation
Value
Absolute change
Change from previous value
jan 1, 1991
2.698 bln
+2.698 bln
0.0%
jan 1, 1992
3.0 bln
+302.628 mln
11.22%
jan 1, 1993
3.184 bln
+183.873 mln
6.13%
jan 1, 1994
2.841 bln
-343.586 mln
-10.79%
jan 1, 1995
2.593 bln
-247.384 mln
-8.71%
jan 1, 1996
2.337 bln
-256.445 mln
-9.89%
jan 1, 1997
2.545 bln
+208.144 mln
8.91%
jan 1, 1998
2.849 bln
+304.079 mln
11.95%
jan 1, 1999
2.535 bln
-314.098 mln
-11.02%
jan 1, 2000
3.412 bln
+876.919 mln
34.59%
jan 1, 2001
3.496 bln
+83.989 mln
2.46%
jan 1, 2002
3.105 bln
-390.842 mln
-11.18%
jan 1, 2003
1.791 bln
-1.314 bln
-42.31%
jan 1, 2004
2.287 bln
+495.584 mln
27.67%
jan 1, 2005
2.826 bln
+538.996 mln
23.57%
jan 1, 2006
3.94 bln
+1.114 bln
39.41%
jan 1, 2007
4.553 bln
+612.957 mln
15.56%
jan 1, 2008
5.713 bln
+1.16 bln
25.48%
jan 1, 2009
7.35 bln
+1.638 bln
28.67%
jan 1, 2010
5.848 bln
-1.503 bln
-20.44%
jan 1, 2011
7.146 bln
+1.298 bln
22.2%
jan 1, 2012
2.744 bln
-4.402 bln
-61.61%
jan 1, 2013
7.512 bln
+4.769 bln
173.82%
jan 1, 2014
5.824 bln
-1.688 bln
-22.47%
jan 1, 2015
3.496 bln
-2.329 bln
-39.98%
Ranking of countries by current statistics by years


Comments: