29
/
en
AIzaSyAYiBZKx7MnpbEhh9jyipgxe19OcubqV5w
April 1, 2024
143941
Guatemala
GTM
true
2
1
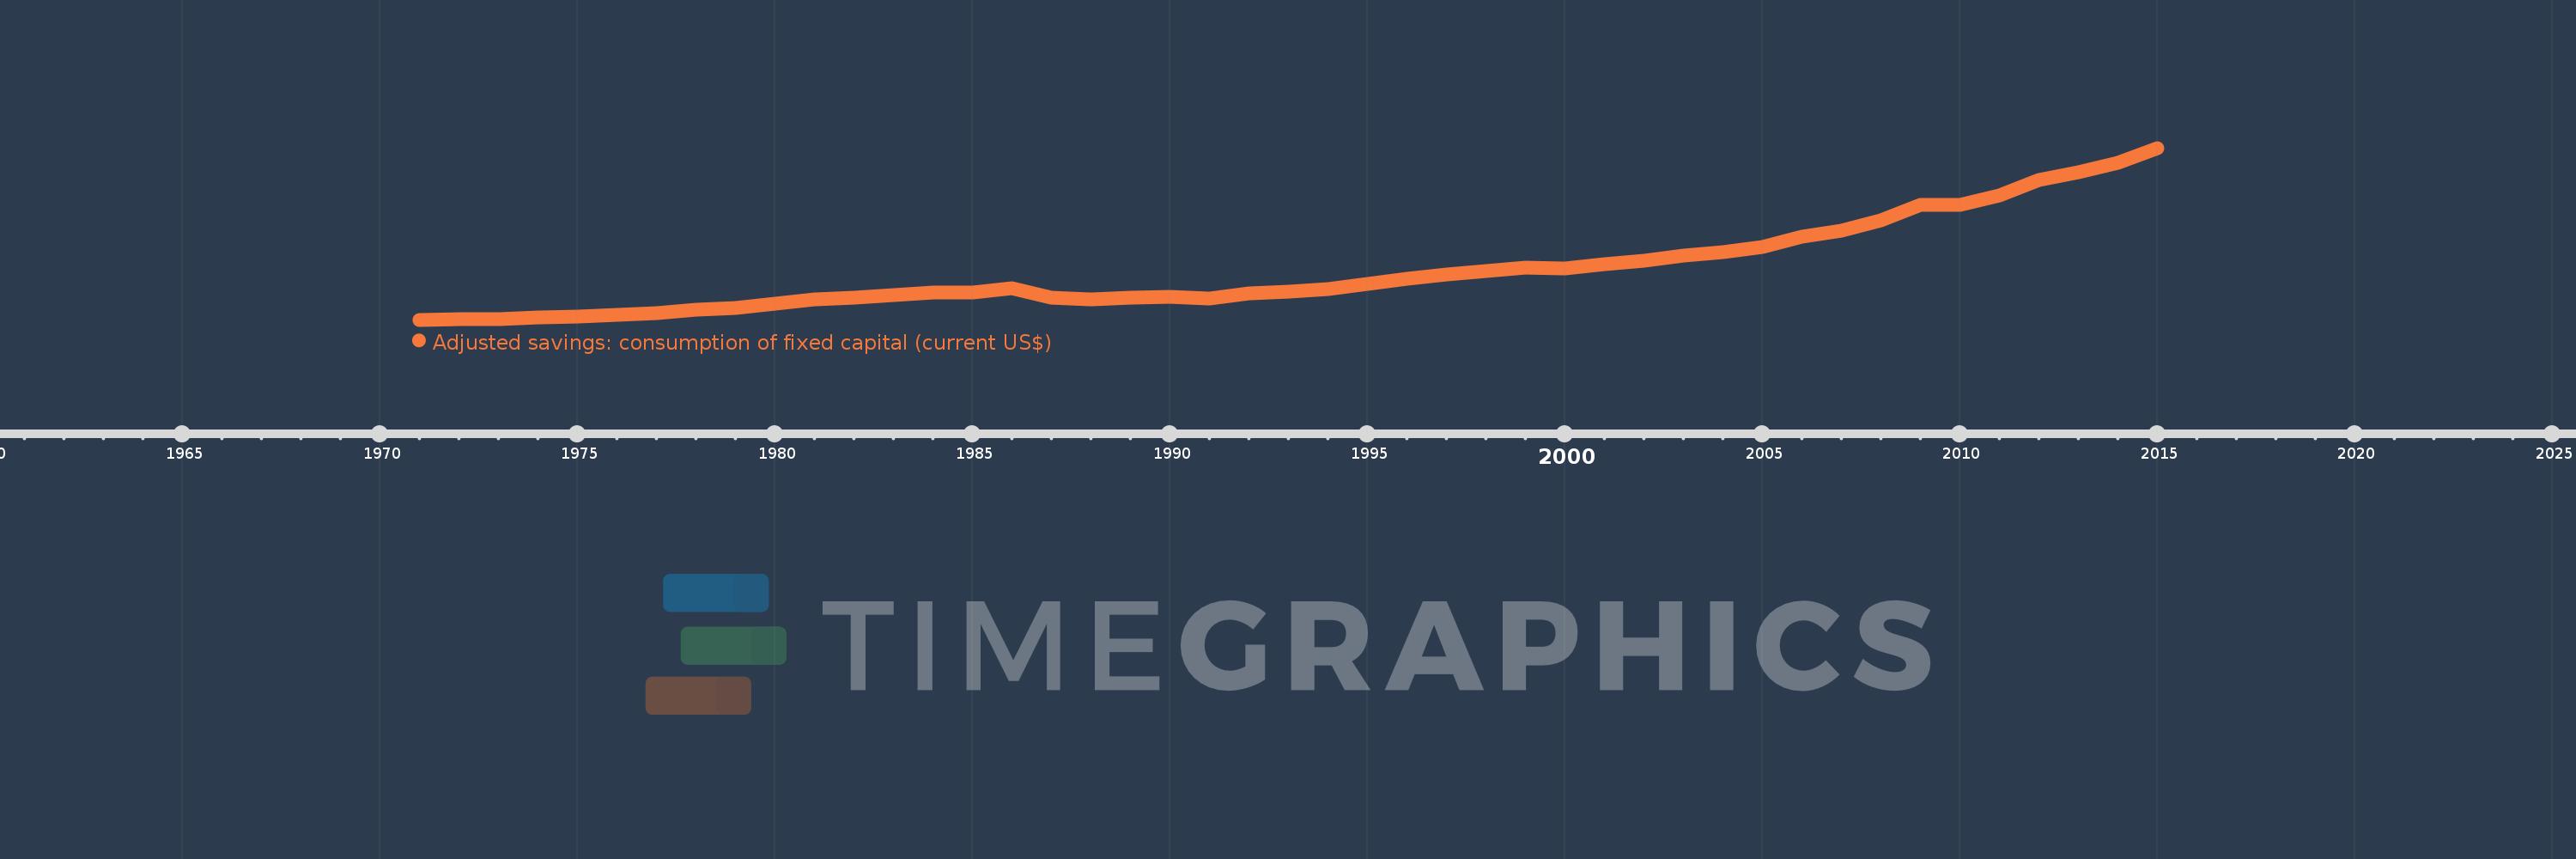
Adjusted savings: consumption of fixed capital (current US$)
2015,2014,2013,2012,2011,2010,2009,2008,2007,2006,2005,2004,2003,2002,2001,2000,1999,1998,1997,1996,1995,1994,1993,1992,1991,1990,1989,1988,1987,1986,1985,1984,1983,1982,1981,1980,1979,1978,1977,1976,1975,1974,1973,1972,1971
This statistics in other country:
AfghanistanAlbaniaAlgeriaAndorraAngolaAntigua and BarbudaArgentinaArmeniaArubaAustraliaAustriaAzerbaijanBahamas, TheBahrainBangladeshBarbadosBelarusBelgiumBelizeBeninBermudaBhutanBoliviaBosnia and HerzegovinaBotswanaBrazilBrunei DarussalamBulgariaBurkina FasoBurundiCabo VerdeCambodiaCameroonCanadaCayman IslandsCentral African RepublicChadChannel IslandsChileChinaColombiaComorosCongo, Dem. Rep.Congo, Rep.Costa RicaCote d'IvoireCroatiaCubaCyprusCzech RepublicDenmarkDjiboutiDominicaDominican RepublicEcuadorEgypt, Arab Rep.El SalvadorEquatorial GuineaEritreaEstoniaEthiopiaFaroe IslandsFijiFinlandFranceFrench PolynesiaGabonGambia, TheGeorgiaGermanyGhanaGreeceGreenlandGrenadaGuatemalaGuineaGuinea-BissauGuyanaHaitiHondurasHong Kong SAR, ChinaHungaryIcelandIndiaIndonesiaIran, Islamic Rep.IraqIrelandIsle of ManIsraelItalyJamaicaJapanJordanKazakhstanKenyaKiribatiKorea, Rep.KosovoKuwaitKyrgyz RepublicLao PDRLatviaLebanonLesothoLiberiaLibyaLiechtensteinLithuaniaLuxembourgMacao SAR, ChinaMacedonia, FYRMadagascarMalawiMalaysiaMaldivesMaliMaltaMarshall IslandsMauritaniaMauritiusMexicoMicronesia, Fed. Sts.MoldovaMonacoMongoliaMontenegroMoroccoMozambiqueMyanmarNamibiaNepalNetherlandsNew CaledoniaNew ZealandNicaraguaNigerNigeriaNorwayOmanPakistanPalauPanamaPapua New GuineaParaguayPeruPhilippinesPolandPortugalPuerto RicoQatarRomaniaRussian FederationRwandaSamoaSan MarinoSao Tome and PrincipeSaudi ArabiaSenegalSerbiaSeychellesSierra LeoneSingaporeSlovak RepublicSloveniaSolomon IslandsSomaliaSouth AfricaSouth SudanSpainSri LankaSt. Kitts and NevisSt. LuciaSt. Vincent and the GrenadinesSudanSurinameSwazilandSwedenSwitzerlandSyrian Arab RepublicTajikistanTanzaniaThailandTimor-LesteTogoTongaTrinidad and TobagoTunisiaTurkeyTurkmenistanTuvaluUgandaUkraineUnited Arab EmiratesUnited KingdomUnited StatesUruguayUzbekistanVanuatuVenezuela, RBVietnamVirgin Islands (U.S.)West Bank and GazaYemen, Rep.ZambiaZimbabwe Timeline:
This timeline shows a graph from 1971 to 2015 of Guatemala. No data until 1970. Number of actual observations by date: 45.
Source name:
World Development Indicators
Source organization:
World Bank staff estimates using data from the United Nations Statistics Division's National Accounts Statistics.
Categories, topics:
Economy & Growth, Environment
Last updated:
apr 23, 2017
Indicators value changes by year
Minimum:
115.937 mln
jan 1, 1971
Maximum:
3.979 bln
jan 1, 2015
At the date of observation
Value
Absolute change
Change from previous value
jan 1, 1971
115.937 mln
+115.937 mln
0.0%
jan 1, 1972
119.93 mln
+3.993 mln
3.44%
jan 1, 1973
131.784 mln
+11.854 mln
9.88%
jan 1, 1974
159.636 mln
+27.852 mln
21.13%
jan 1, 1975
190.377 mln
+30.741 mln
19.26%
jan 1, 1976
231.391 mln
+41.015 mln
21.54%
jan 1, 1977
270.167 mln
+38.776 mln
16.76%
jan 1, 1978
339.59 mln
+69.423 mln
25.7%
jan 1, 1979
384.494 mln
+44.904 mln
13.22%
jan 1, 1980
469.16 mln
+84.666 mln
22.02%
jan 1, 1981
565.071 mln
+95.911 mln
20.44%
jan 1, 1982
620.934 mln
+55.863 mln
9.89%
jan 1, 1983
669.373 mln
+48.44 mln
7.8%
jan 1, 1984
729.356 mln
+59.982 mln
8.96%
jan 1, 1985
733.542 mln
+4.186 mln
0.57%
jan 1, 1986
820.086 mln
+86.544 mln
11.8%
jan 1, 1987
605.255 mln
-214.831 mln
-26.2%
jan 1, 1988
568.033 mln
-37.222 mln
-6.15%
jan 1, 1989
610.339 mln
+42.306 mln
7.45%
jan 1, 1990
638.937 mln
+28.598 mln
4.69%
jan 1, 1991
599.853 mln
-39.084 mln
-6.12%
jan 1, 1992
710.971 mln
+111.118 mln
18.52%
jan 1, 1993
745.046 mln
+34.076 mln
4.79%
jan 1, 1994
802.2 mln
+57.154 mln
7.67%
jan 1, 1995
917.061 mln
+114.861 mln
14.32%
jan 1, 1996
1.033 bln
+116.217 mln
12.67%
jan 1, 1997
1.138 bln
+105.14 mln
10.18%
jan 1, 1998
1.203 bln
+64.926 mln
5.7%
jan 1, 1999
1.282 bln
+78.322 mln
6.51%
jan 1, 2000
1.272 bln
-9.29 mln
-0.72%
jan 1, 2001
1.364 bln
+91.422 mln
7.19%
jan 1, 2002
1.441 bln
+77.547 mln
5.69%
jan 1, 2003
1.556 bln
+114.85 mln
7.97%
jan 1, 2004
1.644 bln
+87.32 mln
5.61%
jan 1, 2005
1.743 bln
+99.429 mln
6.05%
jan 1, 2006
1.983 bln
+240.072 mln
13.77%
jan 1, 2007
2.12 bln
+136.841 mln
6.9%
jan 1, 2008
2.349 bln
+228.788 mln
10.79%
jan 1, 2009
2.691 bln
+342.153 mln
14.57%
jan 1, 2010
2.698 bln
+6.885 mln
0.26%
jan 1, 2011
2.904 bln
+205.926 mln
7.63%
jan 1, 2012
3.25 bln
+346.302 mln
11.93%
jan 1, 2013
3.427 bln
+177.067 mln
5.45%
jan 1, 2014
3.652 bln
+225.497 mln
6.58%
jan 1, 2015
3.979 bln
+326.566 mln
8.94%
Ranking of countries by current statistics by years


Comments: