29
/
en
AIzaSyAYiBZKx7MnpbEhh9jyipgxe19OcubqV5w
April 1, 2024
142478
Greenland
GRL
true
2
1
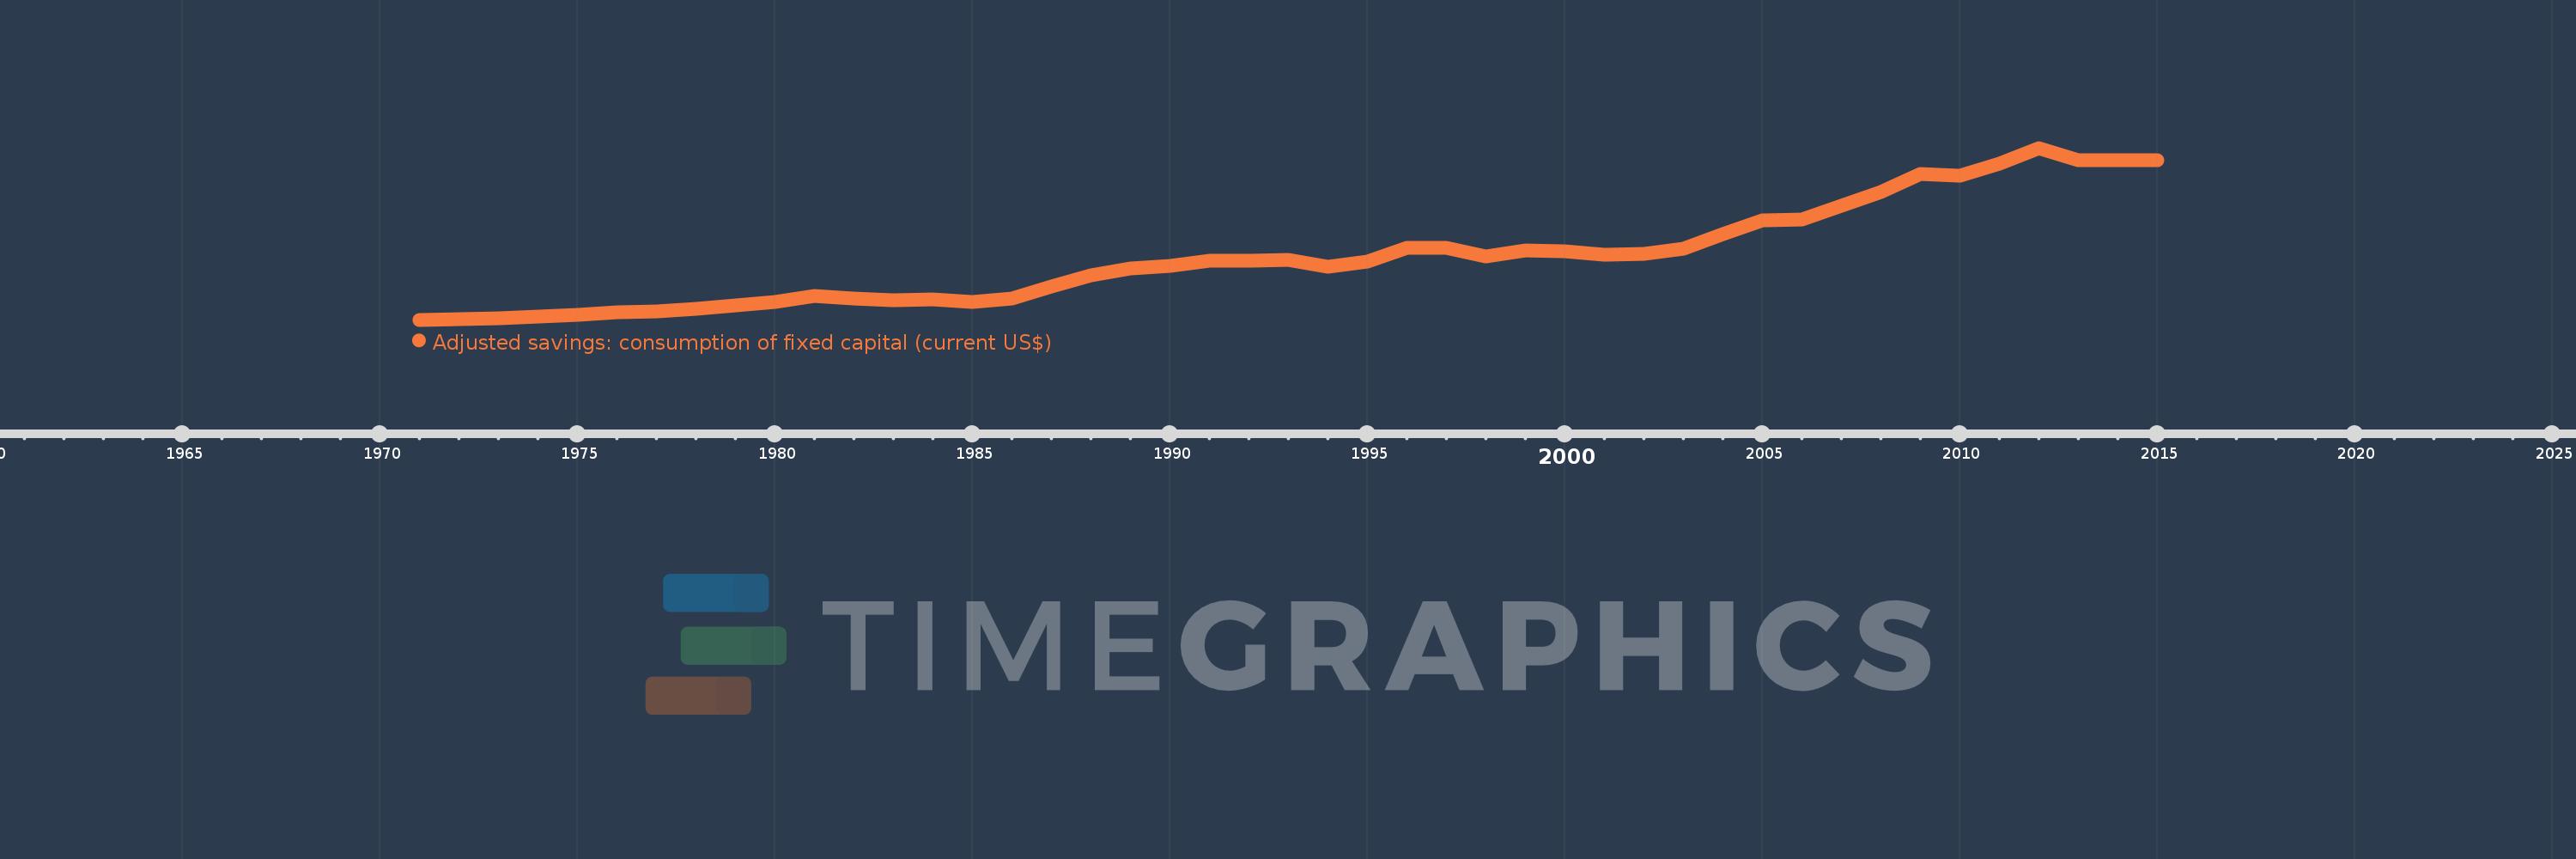
Adjusted savings: consumption of fixed capital (current US$)
2015,2014,2013,2012,2011,2010,2009,2008,2007,2006,2005,2004,2003,2002,2001,2000,1999,1998,1997,1996,1995,1994,1993,1992,1991,1990,1989,1988,1987,1986,1985,1984,1983,1982,1981,1980,1979,1978,1977,1976,1975,1974,1973,1972,1971
This statistics in other country:
AfghanistanAlbaniaAlgeriaAndorraAngolaAntigua and BarbudaArgentinaArmeniaArubaAustraliaAustriaAzerbaijanBahamas, TheBahrainBangladeshBarbadosBelarusBelgiumBelizeBeninBermudaBhutanBoliviaBosnia and HerzegovinaBotswanaBrazilBrunei DarussalamBulgariaBurkina FasoBurundiCabo VerdeCambodiaCameroonCanadaCayman IslandsCentral African RepublicChadChannel IslandsChileChinaColombiaComorosCongo, Dem. Rep.Congo, Rep.Costa RicaCote d'IvoireCroatiaCubaCyprusCzech RepublicDenmarkDjiboutiDominicaDominican RepublicEcuadorEgypt, Arab Rep.El SalvadorEquatorial GuineaEritreaEstoniaEthiopiaFaroe IslandsFijiFinlandFranceFrench PolynesiaGabonGambia, TheGeorgiaGermanyGhanaGreeceGreenlandGrenadaGuatemalaGuineaGuinea-BissauGuyanaHaitiHondurasHong Kong SAR, ChinaHungaryIcelandIndiaIndonesiaIran, Islamic Rep.IraqIrelandIsle of ManIsraelItalyJamaicaJapanJordanKazakhstanKenyaKiribatiKorea, Rep.KosovoKuwaitKyrgyz RepublicLao PDRLatviaLebanonLesothoLiberiaLibyaLiechtensteinLithuaniaLuxembourgMacao SAR, ChinaMacedonia, FYRMadagascarMalawiMalaysiaMaldivesMaliMaltaMarshall IslandsMauritaniaMauritiusMexicoMicronesia, Fed. Sts.MoldovaMonacoMongoliaMontenegroMoroccoMozambiqueMyanmarNamibiaNepalNetherlandsNew CaledoniaNew ZealandNicaraguaNigerNigeriaNorwayOmanPakistanPalauPanamaPapua New GuineaParaguayPeruPhilippinesPolandPortugalPuerto RicoQatarRomaniaRussian FederationRwandaSamoaSan MarinoSao Tome and PrincipeSaudi ArabiaSenegalSerbiaSeychellesSierra LeoneSingaporeSlovak RepublicSloveniaSolomon IslandsSomaliaSouth AfricaSouth SudanSpainSri LankaSt. Kitts and NevisSt. LuciaSt. Vincent and the GrenadinesSudanSurinameSwazilandSwedenSwitzerlandSyrian Arab RepublicTajikistanTanzaniaThailandTimor-LesteTogoTongaTrinidad and TobagoTunisiaTurkeyTurkmenistanTuvaluUgandaUkraineUnited Arab EmiratesUnited KingdomUnited StatesUruguayUzbekistanVanuatuVenezuela, RBVietnamVirgin Islands (U.S.)West Bank and GazaYemen, Rep.ZambiaZimbabwe Timeline:
This timeline shows a graph from 1971 to 2015 of Greenland. No data until 1970. Number of actual observations by date: 45.
Source name:
World Development Indicators
Source organization:
World Bank staff estimates using data from the United Nations Statistics Division's National Accounts Statistics.
Categories, topics:
Economy & Growth, Environment
Last updated:
apr 23, 2017
Indicators value changes by year
Minimum:
5.509 mln
jan 1, 1971
Maximum:
311.522 mln
jan 1, 2012
At the date of observation
Value
Absolute change
Change from previous value
jan 1, 1971
5.509 mln
+5.509 mln
0.0%
jan 1, 1972
7.106 mln
+1.598 mln
29.0%
jan 1, 1973
8.55 mln
+1.443 mln
20.31%
jan 1, 1974
11.361 mln
+2.812 mln
32.89%
jan 1, 1975
13.847 mln
+2.485 mln
21.88%
jan 1, 1976
18.25 mln
+4.403 mln
31.8%
jan 1, 1977
20.94 mln
+2.69 mln
14.74%
jan 1, 1978
24.801 mln
+3.861 mln
18.44%
jan 1, 1979
31.499 mln
+6.697 mln
27.0%
jan 1, 1980
37.384 mln
+5.885 mln
18.68%
jan 1, 1981
47.474 mln
+10.09 mln
26.99%
jan 1, 1982
43.411 mln
-4.063 mln
-8.56%
jan 1, 1983
39.848 mln
-3.563 mln
-8.21%
jan 1, 1984
41.314 mln
+1.466 mln
3.68%
jan 1, 1985
37.393 mln
-3.922 mln
-9.49%
jan 1, 1986
44.031 mln
+6.638 mln
17.75%
jan 1, 1987
64.752 mln
+20.721 mln
47.06%
jan 1, 1988
84.942 mln
+20.19 mln
31.18%
jan 1, 1989
97.375 mln
+12.433 mln
14.64%
jan 1, 1990
101.357 mln
+3.982 mln
4.09%
jan 1, 1991
110.703 mln
+9.346 mln
9.22%
jan 1, 1992
110.431 mln
-272.848K
-0.25%
jan 1, 1993
112.166 mln
+1.735 mln
1.57%
jan 1, 1994
99.678 mln
-12.488 mln
-11.13%
jan 1, 1995
108.691 mln
+9.013 mln
9.04%
jan 1, 1996
134.02 mln
+25.329 mln
23.3%
jan 1, 1997
133.022 mln
-997.793K
-0.74%
jan 1, 1998
118.928 mln
-14.094 mln
-10.6%
jan 1, 1999
129.053 mln
+10.125 mln
8.51%
jan 1, 2000
127.269 mln
-1.784 mln
-1.38%
jan 1, 2001
121.515 mln
-5.754 mln
-4.52%
jan 1, 2002
123.298 mln
+1.783 mln
1.47%
jan 1, 2003
132.394 mln
+9.096 mln
7.38%
jan 1, 2004
157.995 mln
+25.601 mln
19.34%
jan 1, 2005
181.873 mln
+23.878 mln
15.11%
jan 1, 2006
184.302 mln
+2.429 mln
1.34%
jan 1, 2007
208.421 mln
+24.119 mln
13.09%
jan 1, 2008
233.334 mln
+24.913 mln
11.95%
jan 1, 2009
265.321 mln
+31.987 mln
13.71%
jan 1, 2010
262.494 mln
-2.827 mln
-1.07%
jan 1, 2011
283.739 mln
+21.245 mln
8.09%
jan 1, 2012
311.522 mln
+27.783 mln
9.79%
jan 1, 2013
290.104 mln
-21.418 mln
-6.88%
jan 1, 2014
289.923 mln
-180.777K
-0.06%
jan 1, 2015
290.011 mln
+87.755K
0.03%
Ranking of countries by current statistics by years


Comments: