29
/
en
AIzaSyAYiBZKx7MnpbEhh9jyipgxe19OcubqV5w
April 1, 2024
90719
Brazil
BRA
true
2
1
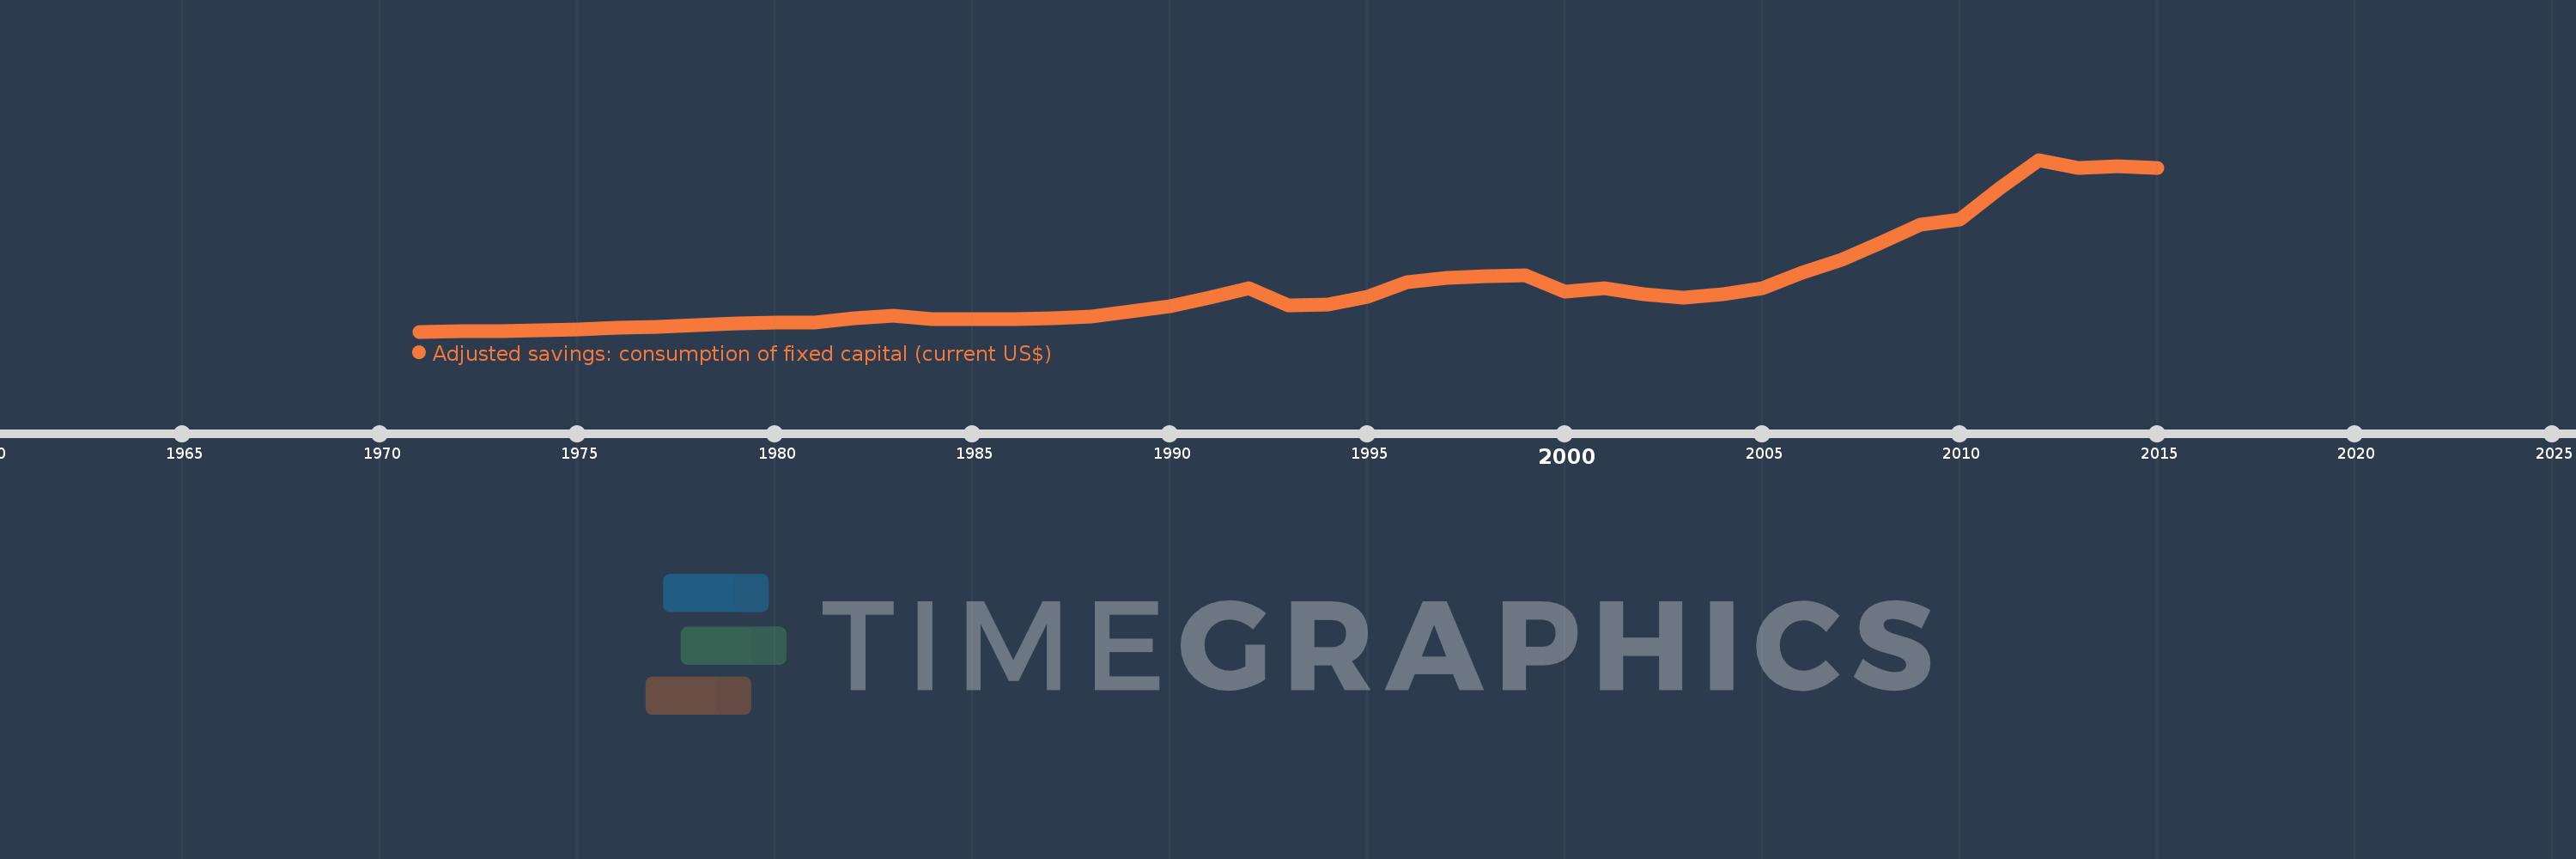
Adjusted savings: consumption of fixed capital (current US$)
2015,2014,2013,2012,2011,2010,2009,2008,2007,2006,2005,2004,2003,2002,2001,2000,1999,1998,1997,1996,1995,1994,1993,1992,1991,1990,1989,1988,1987,1986,1985,1984,1983,1982,1981,1980,1979,1978,1977,1976,1975,1974,1973,1972,1971
This statistics in other country:
AfghanistanAlbaniaAlgeriaAndorraAngolaAntigua and BarbudaArgentinaArmeniaArubaAustraliaAustriaAzerbaijanBahamas, TheBahrainBangladeshBarbadosBelarusBelgiumBelizeBeninBermudaBhutanBoliviaBosnia and HerzegovinaBotswanaBrazilBrunei DarussalamBulgariaBurkina FasoBurundiCabo VerdeCambodiaCameroonCanadaCayman IslandsCentral African RepublicChadChannel IslandsChileChinaColombiaComorosCongo, Dem. Rep.Congo, Rep.Costa RicaCote d'IvoireCroatiaCubaCyprusCzech RepublicDenmarkDjiboutiDominicaDominican RepublicEcuadorEgypt, Arab Rep.El SalvadorEquatorial GuineaEritreaEstoniaEthiopiaFaroe IslandsFijiFinlandFranceFrench PolynesiaGabonGambia, TheGeorgiaGermanyGhanaGreeceGreenlandGrenadaGuatemalaGuineaGuinea-BissauGuyanaHaitiHondurasHong Kong SAR, ChinaHungaryIcelandIndiaIndonesiaIran, Islamic Rep.IraqIrelandIsle of ManIsraelItalyJamaicaJapanJordanKazakhstanKenyaKiribatiKorea, Rep.KosovoKuwaitKyrgyz RepublicLao PDRLatviaLebanonLesothoLiberiaLibyaLiechtensteinLithuaniaLuxembourgMacao SAR, ChinaMacedonia, FYRMadagascarMalawiMalaysiaMaldivesMaliMaltaMarshall IslandsMauritaniaMauritiusMexicoMicronesia, Fed. Sts.MoldovaMonacoMongoliaMontenegroMoroccoMozambiqueMyanmarNamibiaNepalNetherlandsNew CaledoniaNew ZealandNicaraguaNigerNigeriaNorwayOmanPakistanPalauPanamaPapua New GuineaParaguayPeruPhilippinesPolandPortugalPuerto RicoQatarRomaniaRussian FederationRwandaSamoaSan MarinoSao Tome and PrincipeSaudi ArabiaSenegalSerbiaSeychellesSierra LeoneSingaporeSlovak RepublicSloveniaSolomon IslandsSomaliaSouth AfricaSouth SudanSpainSri LankaSt. Kitts and NevisSt. LuciaSt. Vincent and the GrenadinesSudanSurinameSwazilandSwedenSwitzerlandSyrian Arab RepublicTajikistanTanzaniaThailandTimor-LesteTogoTongaTrinidad and TobagoTunisiaTurkeyTurkmenistanTuvaluUgandaUkraineUnited Arab EmiratesUnited KingdomUnited StatesUruguayUzbekistanVanuatuVenezuela, RBVietnamVirgin Islands (U.S.)West Bank and GazaYemen, Rep.ZambiaZimbabwe Timeline:
This timeline shows a graph from 1971 to 2015 of Brazil. No data until 1970. Number of actual observations by date: 45.
Source name:
World Development Indicators
Source organization:
World Bank staff estimates using data from the United Nations Statistics Division's National Accounts Statistics.
Categories, topics:
Economy & Growth, Environment
Last updated:
apr 23, 2017
Indicators value changes by year
Minimum:
3.384 bln
jan 1, 1971
Maximum:
293.483 bln
jan 1, 2012
At the date of observation
Value
Absolute change
Change from previous value
jan 1, 1971
3.384 bln
+3.384 bln
0.0%
jan 1, 1972
3.746 bln
+361.902 mln
10.69%
jan 1, 1973
4.328 bln
+581.743 mln
15.53%
jan 1, 1974
5.564 bln
+1.237 bln
28.58%
jan 1, 1975
7.398 bln
+1.833 bln
32.95%
jan 1, 1976
9.287 bln
+1.889 bln
25.53%
jan 1, 1977
11.585 bln
+2.299 bln
24.76%
jan 1, 1978
14.498 bln
+2.912 bln
25.14%
jan 1, 1979
17.114 bln
+2.616 bln
18.05%
jan 1, 1980
18.897 bln
+1.783 bln
10.42%
jan 1, 1981
19.024 bln
+127.001 mln
0.67%
jan 1, 1982
25.178 bln
+6.154 bln
32.35%
jan 1, 1983
30.457 bln
+5.278 bln
20.96%
jan 1, 1984
24.581 bln
-5.875 bln
-19.29%
jan 1, 1985
25.076 bln
+494.72 mln
2.01%
jan 1, 1986
24.811 bln
-265.345 mln
-1.06%
jan 1, 1987
25.7 bln
+888.883 mln
3.58%
jan 1, 1988
29.01 bln
+3.31 bln
12.88%
jan 1, 1989
37.198 bln
+8.189 bln
28.23%
jan 1, 1990
45.96 bln
+8.762 bln
23.55%
jan 1, 1991
60.218 bln
+14.258 bln
31.02%
jan 1, 1992
76.145 bln
+15.927 bln
26.45%
jan 1, 1993
47.831 bln
-28.314 bln
-37.18%
jan 1, 1994
49.353 bln
+1.522 bln
3.18%
jan 1, 1995
61.611 bln
+12.258 bln
24.84%
jan 1, 1996
86.483 bln
+24.872 bln
40.37%
jan 1, 1997
94.41 bln
+7.927 bln
9.17%
jan 1, 1998
97.084 bln
+2.674 bln
2.83%
jan 1, 1999
98.869 bln
+1.785 bln
1.84%
jan 1, 2000
71.342 bln
-27.527 bln
-27.84%
jan 1, 2001
76.003 bln
+4.661 bln
6.53%
jan 1, 2002
65.963 bln
-10.04 bln
-13.21%
jan 1, 2003
60.203 bln
-5.759 bln
-8.73%
jan 1, 2004
66.915 bln
+6.712 bln
11.15%
jan 1, 2005
77.342 bln
+10.427 bln
15.58%
jan 1, 2006
102.434 bln
+25.092 bln
32.44%
jan 1, 2007
125.056 bln
+22.621 bln
22.08%
jan 1, 2008
153.465 bln
+28.409 bln
22.72%
jan 1, 2009
184.115 bln
+30.65 bln
19.97%
jan 1, 2010
192.995 bln
+8.879 bln
4.82%
jan 1, 2011
244.548 bln
+51.554 bln
26.71%
jan 1, 2012
293.483 bln
+48.935 bln
20.01%
jan 1, 2013
279.225 bln
-14.259 bln
-4.86%
jan 1, 2014
282.829 bln
+3.604 bln
1.29%
jan 1, 2015
280.157 bln
-2.672 bln
-0.94%
Ranking of countries by current statistics by years


Comments: